
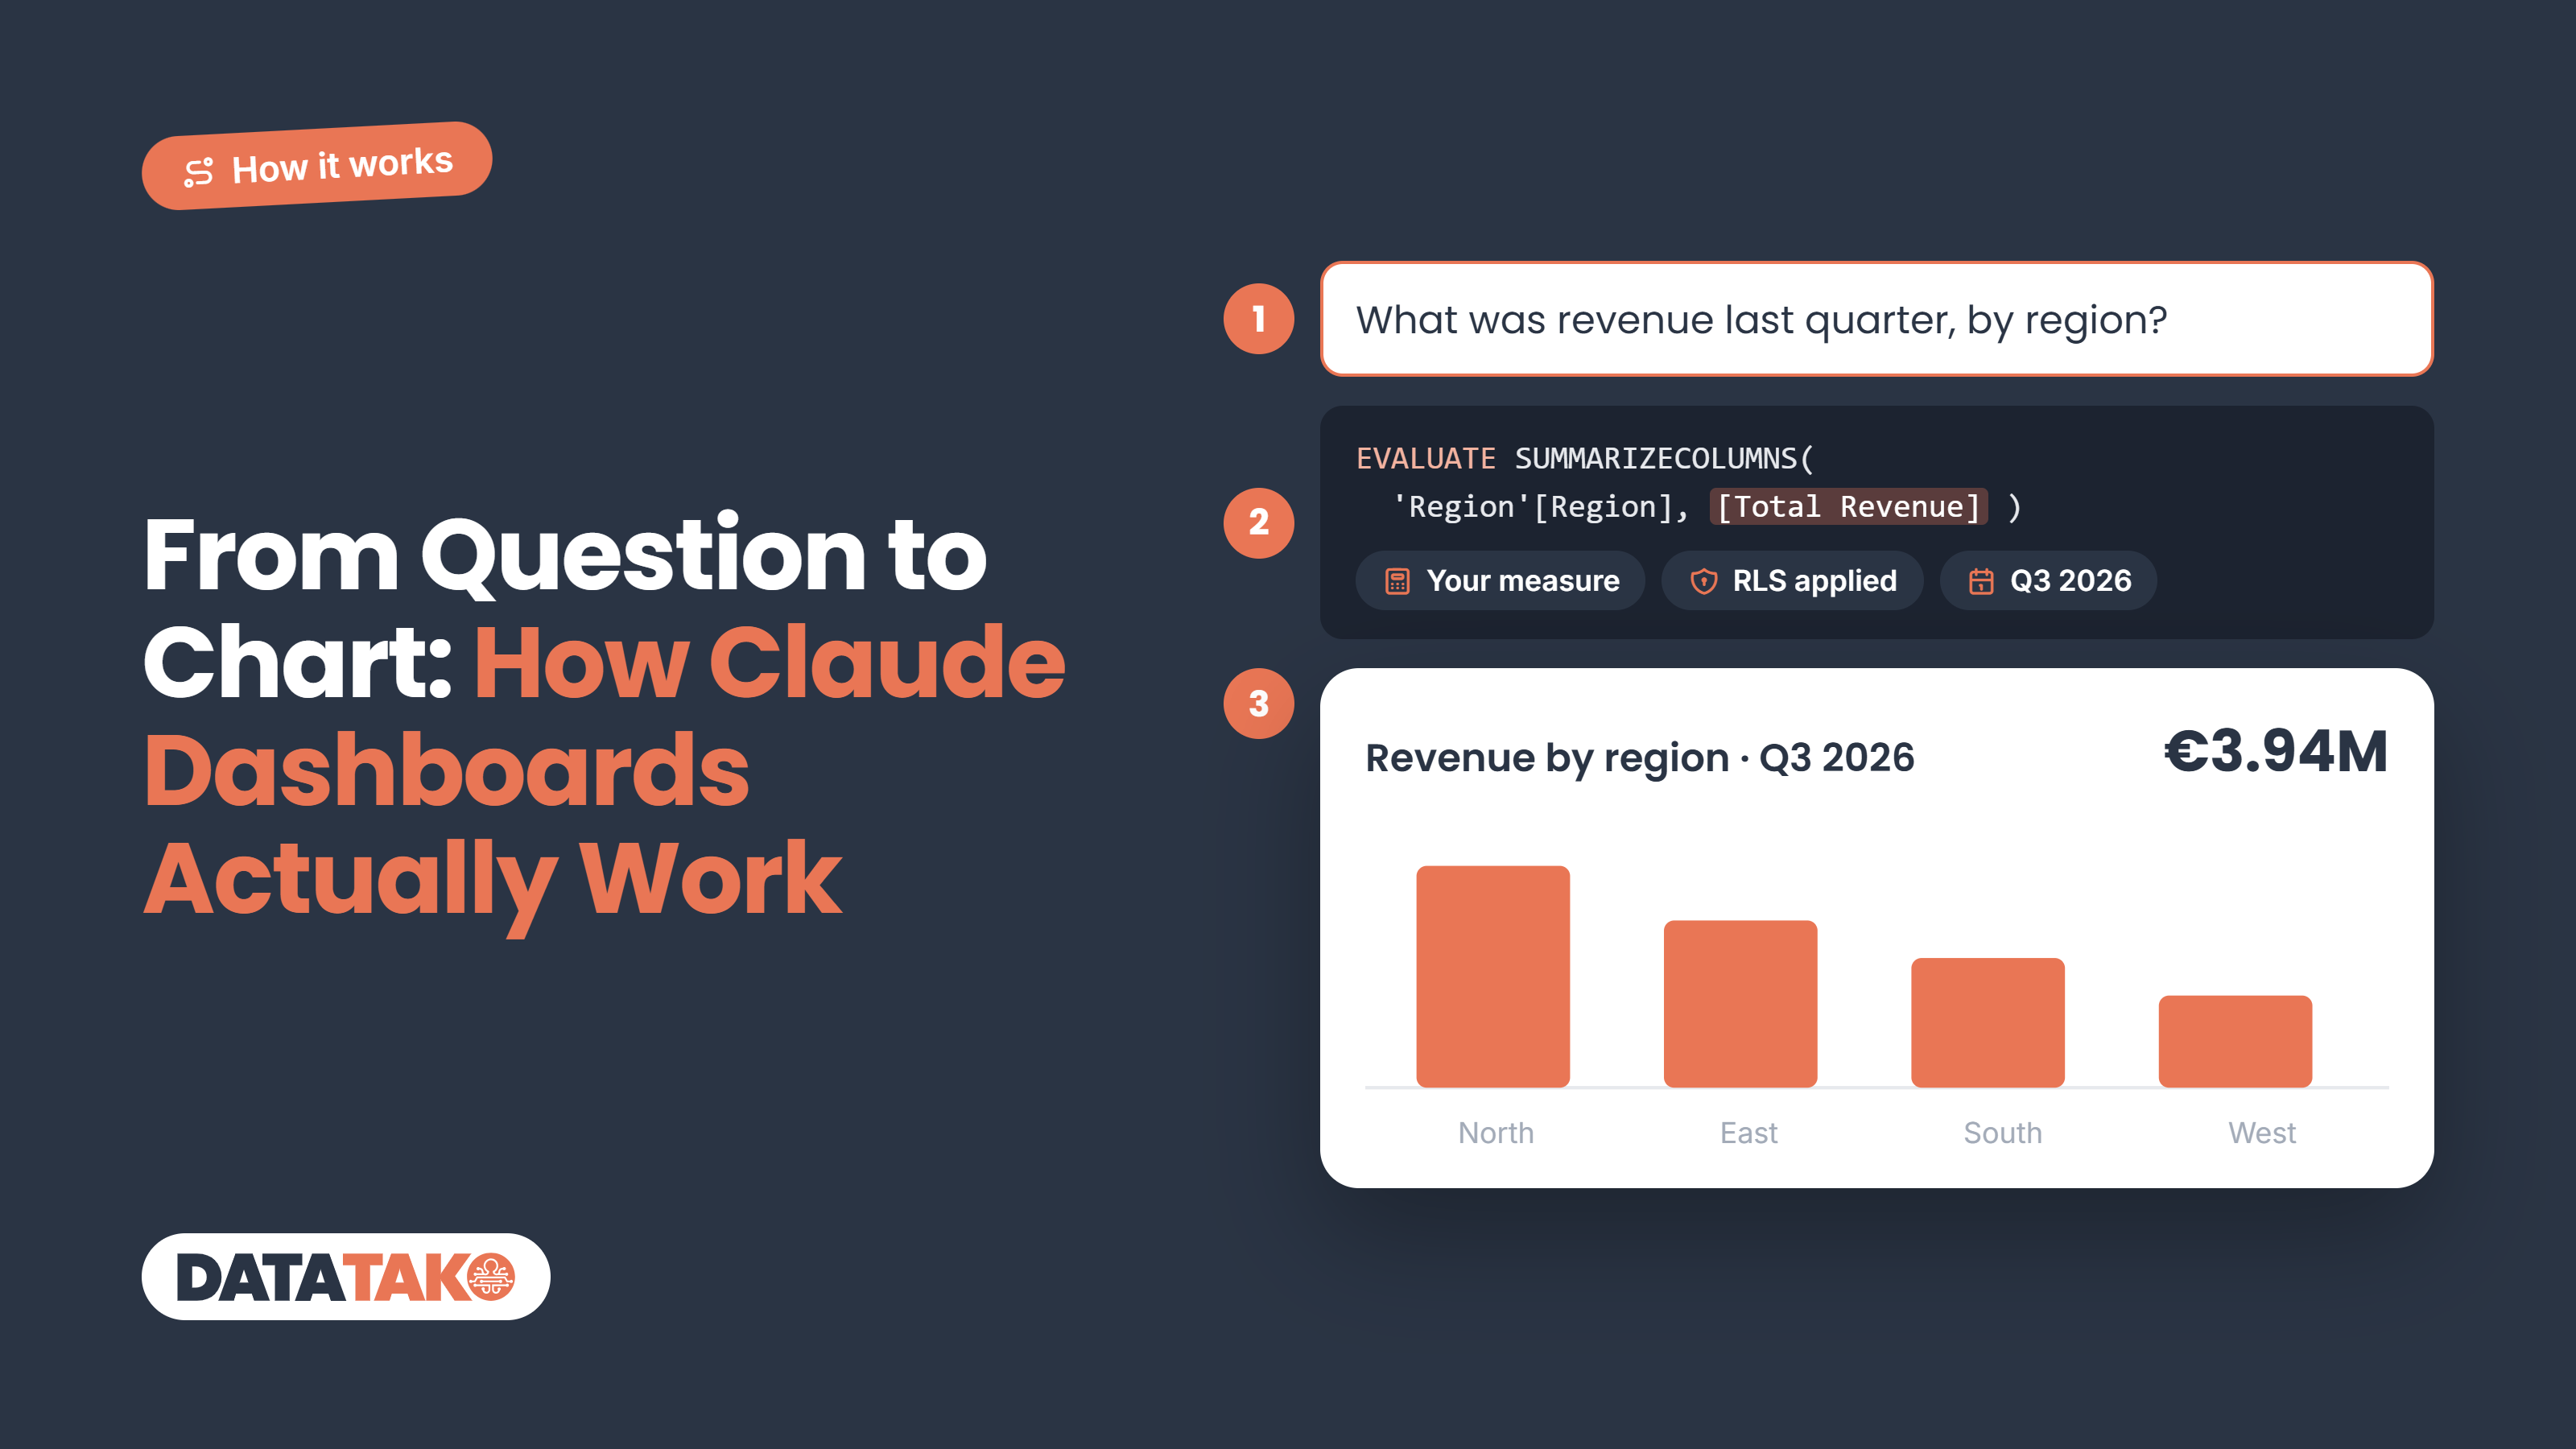
Short answer: Claude Dashboards turns a plain-language question into a dashboard in four steps. It reads your connected data source, writes a query for each chart (SQL on a warehouse, DAX on a Power BI semantic model), stores the result as a dataset, and builds an interactive page on top of it. Every number links back to the query that produced it, so you can check it. That transparency is what makes it trustworthy. It's also why the quality of your data model decides the quality of the answer.
"AI made me a dashboard" sounds like magic, and magic is hard to trust with your revenue numbers. So let's take the magic out. Here's what actually happens between the moment you type a question and the moment a chart appears, and where in that process things can go wrong.
TL;DR
- It starts with a connector. Claude reads data through connectors to sources like Snowflake, BigQuery, Databricks or Salesforce.
- Claude writes the query. One query per chart: SQL against a warehouse, or DAX against a Power BI semantic model.
- Results become datasets. Each dataset is a single table, either a live query or a stored extract.
- The page is built on top. Charts, tabs, filters and tables, drawn from those datasets.
- Every number is traceable. Click it to see the query, the rows and when it was last refreshed.
- Garbage in, garbage out. Clear table names and a clean data model matter more than a clever prompt.
Step 1: connecting your data
Claude can't see your data until you connect it. That happens through connectors, which are MCP servers that let Claude query a source in a controlled way. Anthropic names Amazon Redshift, BigQuery, ClickHouse, Databricks and Snowflake, plus apps like Salesforce.
Power BI works too, with some setup. There's no ready-made Microsoft connector for Claude yet, but Tabular Editor showed that Microsoft's Power BI MCP server can be added as a custom connector. Claude then queries your semantic model directly.
How the data gets into the dashboard matters, because there are two ways:
- Live queries run again on every refresh, with the viewer's own connection and permissions. Two people can see different numbers if their access differs.
- Extracts are stored snapshots, as CSV or JSON. Refreshing means extracting again, and anyone who can open the dashboard can read the file.
Local connectors that run on your own machine can only deliver extracts while you build. For a dashboard that stays live after you publish it, you need a remote connector.
Step 2: asking the question
You start in a normal chat. Ask for a dashboard, or pick Dashboards as the output. Then describe what you want to see, in plain language:
"Build a dashboard on the sales.orders table in Snowflake. Show monthly revenue for 2026 compared to 2025, revenue by region, and the top 10 customers. Add a filter for product category."
Anthropic's own tip is the most useful one: name the specific table or app the data lives in. "Revenue" means nothing to Claude until it knows where revenue is stored. The more specific the question, the less Claude has to guess.
Step 3: Claude writes the query (SQL or DAX)
This is the core of it. Claude reads the structure of your source, the tables, columns and relationships, and translates each part of your question into a query. It writes in the language your source speaks.
On a warehouse, that's SQL. For "monthly revenue for 2026", Claude might write something like:
SELECT DATE_TRUNC('month', order_date) AS month,
       SUM(amount) AS revenue
FROM sales.orders
WHERE order_date >= '2026-01-01'
GROUP BY 1
ORDER BY 1;
On a Power BI semantic model, that's DAX. And this is where it gets interesting for Power BI teams. Instead of rebuilding revenue from raw columns, Claude can use the measures you already defined:
EVALUATE
SUMMARIZECOLUMNS (
    'Date'[Month],
    FILTER ( 'Date', 'Date'[Year] = 2026 ),
    "Revenue", [Total Revenue]
)
That difference matters. With SQL, Claude decides how revenue is calculated. With DAX on a semantic model, it reuses [Total Revenue], the same measure your official reports use, with the same filters and business logic. The numbers match by design, not by luck.
Claude also tests its queries while it builds. If a query fails or returns something odd, it adjusts before the chart ever appears.
Step 4: from query to chart
Each query result becomes a dataset: one table with a title, an optional description and its source. Tabular Editor found each dataset is capped at 8 MB, which is plenty for charts and summaries but not for full transaction lists.
Then Claude builds the page on top of those datasets. It picks a chart type that fits the data: a line for a trend over months, bars for regions, a table for the top 10. The page can include:
- Charts drawn with d3
- Tabs for an overview and a details page
- Cross-filters, so clicking a region filters the rest
- Date and text slicers
- Searchable tables
One rule holds everything together: every value on the page must come from a dataset. Small calculations on the page, like a share of the total, are done in JavaScript on top of that data. They don't go back to your source.
Transparency: check every number
This is the part that makes Claude Dashboards different from "AI said so". Anthropic puts it simply: "Click any number to see the query behind it, or ask Claude to explain it."
- See the query. Every chart shows the SQL or DAX that produced it. An analyst can check it in seconds.
- See the freshness. Each chart shows when its data was last refreshed.
- See the rows. The Sources pane shows the dataset behind a chart, and you can download it as CSV.
- Fix it in place. Editors can edit, test and restore live queries. Or tell Claude in the chat what's wrong.
- Ask why. "Ask Claude" explains how a number was calculated, in plain language.
One thing to watch: the interface doesn't make it obvious whether a dashboard is live or built on extracts. A refresh button only appears for live queries. If it matters, check the source of a number before you share it.
Where it can go wrong, and how to prevent it
Claude is good at writing queries. It can't fix ambiguity it doesn't know about. Most wrong numbers come from one of these:
- Vague questions. "Show me sales" can mean orders, invoices or revenue after returns. Say which one.
- Unclear column names. A column called amt2 forces Claude to guess. Readable names and descriptions help it pick the right one.
- Definitions that live in people's heads. If "active customer" means "ordered in the last 90 days" only in your sales team's minds, Claude will invent its own definition.
- Recalculated metrics. On a warehouse, Claude builds metrics from raw columns. That can drift from your official definitions. On a semantic model, ask it to use your existing measures.
- Messy data. Duplicates, test records and missing dates end up in the chart, just as they would in any other report.
Tips for better results:
- Name the table, model or app in your question.
- Spell out the definition of each KPI, or point to the measure that holds it.
- Check the query behind your most important number before you share.
- Prefer a semantic model over raw tables when one exists.
- Iterate in the chat: "switch to weekly", "exclude test accounts", "add last year as a comparison".
Your AI dashboard is only as good as your data model
If there's one lesson in how Claude Dashboards works, it's this: the AI is the easy part. The hard part is a data model with clear names, agreed definitions and measures everyone trusts. That's exactly what a good Power BI semantic model already is. And because Claude can write DAX on top of it, every AI-built chart can reuse the same [Total Revenue] your finance team signs off on.
That's also how DataTako approaches AI dashboards. Your semantic model stays in Power BI. An AI app like Claude connects to DataTako through the AI connector (MCP), reads the model, writes and tests its queries, and builds a fully custom data dashboard. Every query runs in Power BI with the row-level security of the person viewing it. And the dashboard is shared through your branded portal, with the same user and group access as your reports, so clients see only their own data without a Power BI Pro licence each.
Want to see the steps? We walk through them in Creating Power BI dashboards with AI.
Frequently asked questions
How does Claude build a dashboard?
Claude reads your connected data source, writes a query for each chart, stores each result as a dataset, and builds an interactive page on top. Every number links back to its query, so you can check how it was calculated.
Does Claude write SQL or DAX?
Both, depending on the source. On a data warehouse like Snowflake or BigQuery it writes SQL. On a Power BI semantic model, connected through an MCP server, it writes DAX and can reuse the measures you already defined.
Can I see the query behind a chart?
Yes. Click any number to see its query, the underlying rows and when the data was last refreshed. Editors can also edit and test live queries, or ask Claude to explain a number.
Is the data in a Claude dashboard live?
It can be. Live queries run again on refresh with the viewer's own permissions. Extracts are stored snapshots that need to be refreshed by extracting again. A refresh button only appears for live queries.
How do I get more accurate AI dashboards?
Name the table or model in your question, spell out KPI definitions, and use a semantic model with existing measures when you have one. Then check the query behind your most important numbers before you share the dashboard.

