


The honest limitations of Power BI
No platform is perfect. Where Power BI falls short:
Licensing complexity. Five overlapping models (Pro, PPU, Premium, Embedded, Fabric) make pricing hard to predict. See the hidden costs of Power BI Pro for BI agencies.
External user friction. Sharing with people outside your organization is painful. Microsoft's path (B2B guest accounts) scales poorly; the alternative (Power BI Embedded) requires significant engineering work.
Multi-tenant security. Configuring Row-Level Security to correctly isolate customer data takes expertise — and mistakes leak sensitive information.
Branding limitations. Power BI Service looks like Microsoft. Real white-labeling requires Embedded plus careful configuration.
Operational maintenance. Microsoft updates APIs frequently. Embed tokens expire. Capacity needs monitoring. Someone has to handle all of this.
How easy is Power BI to learn?
It depends what "learn" means:
- Basic reports: a few days. If you've used Excel, the drag-and-drop builder is intuitive.
- DAX proficiency: weeks to months. The formula language is conceptually demanding.
- Data modeling: several months. Star schemas, relationships, performance optimization.
- Embedded scenarios & capacity management: a year or more of hands-on work.
Most teams find report-building easy and the operational complexity harder than expected. Microsoft offers free training through Microsoft Learn, plus official certifications (PL-300 for analysts, DP-500/DP-600 for engineers).
How to set up Power BI: a quick walkthrough
Six steps to get from zero to your first published report:
- Download Power BI Desktop (free, Windows only — Mac users run it in a VM)
- Connect to a data source via one of hundreds of built-in connectors
- Build a data model — define relationships, write DAX measures
- Design your report — drag fields onto the canvas, add visuals
- Publish to Power BI Service (requires a Pro license)
- Decide on a sharing strategy — internal versus external paths diverge significantly here
For the embedded path specifically, see our complete 2026 Power BI Embedded guide.
Power BI use cases across industries
- Financial services: regulatory reporting, risk dashboards, portfolio tracking. Industry playbook →
- BI consultancies: multi-tenant client reporting portals. Industry playbook →
- Marketing agencies: branded client dashboards pulling from Google Analytics, Meta, LinkedIn. Industry playbook →
- Manufacturing: real-time production monitoring, supply chain visibility.
- Healthcare: patient outcome tracking, claims analysis, compliance reporting.
- Retail & e-commerce: sales performance, inventory analysis, demand forecasting.
- HR & people analytics: workforce planning, recruitment metrics, engagement tracking. Industry playbook →
- Cybersecurity & compliance: security operations, audit reporting, compliance evidence. Industry playbook →
Internal users vs external users: the critical distinction
If you remember nothing else from this guide: using Power BI for internal employees is fundamentally different from using it for external users.
For internal users, the path is straightforward. Buy Pro licenses, publish to your workspace, share with named users via their work email, manage permissions through Microsoft Entra ID. Cost is predictable, security is well-understood.
For external users — customers, partners, clients — the path forks:
- B2B guest accounts: add each external user to your tenant. Works at small scale, becomes painful past 25-50 users.
- Power BI Embedded: your app authenticates users; Power BI sees them through embed tokens. Scales infinitely but requires significant engineering investment.
- Publish to web: truly public, no security. Marketing content only.
- PDF or email exports: kills interactivity, adds operational overhead.
For deeper comparison, see 4 ways to share Power BI reports with external users and Power BI external sharing without Microsoft 365 guest accounts.
The decision ripples through your architecture and costs for years. Choosing well at the start matters.
When Power BI alone isn't enough: where DataTako fits
Power BI was designed for internal BI. For external-facing analytics, you either build a significant infrastructure layer yourself, or use a platform that handles it for you.
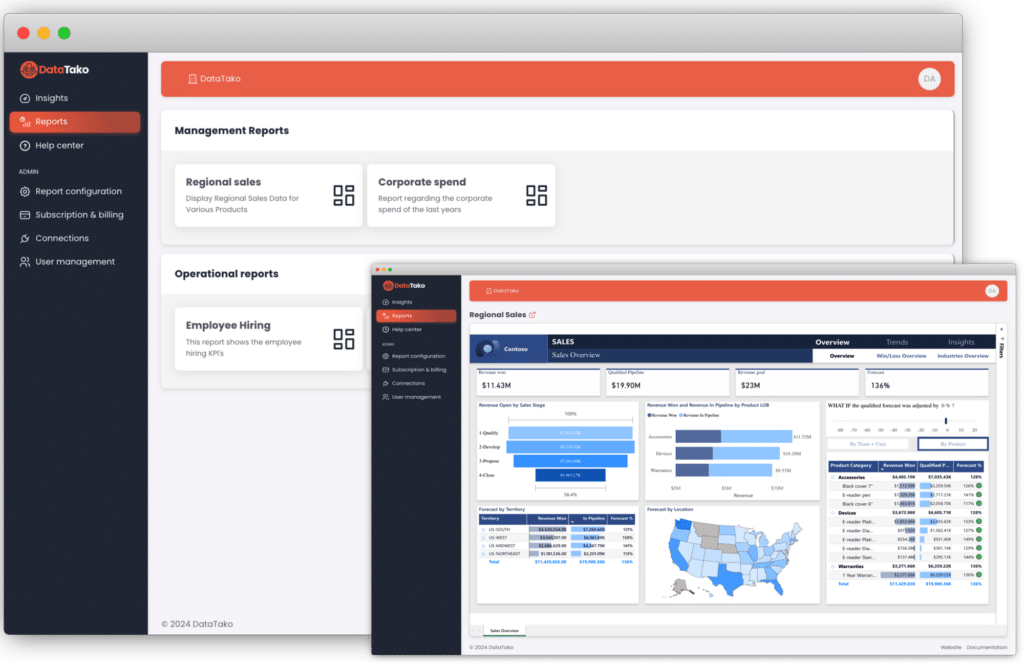
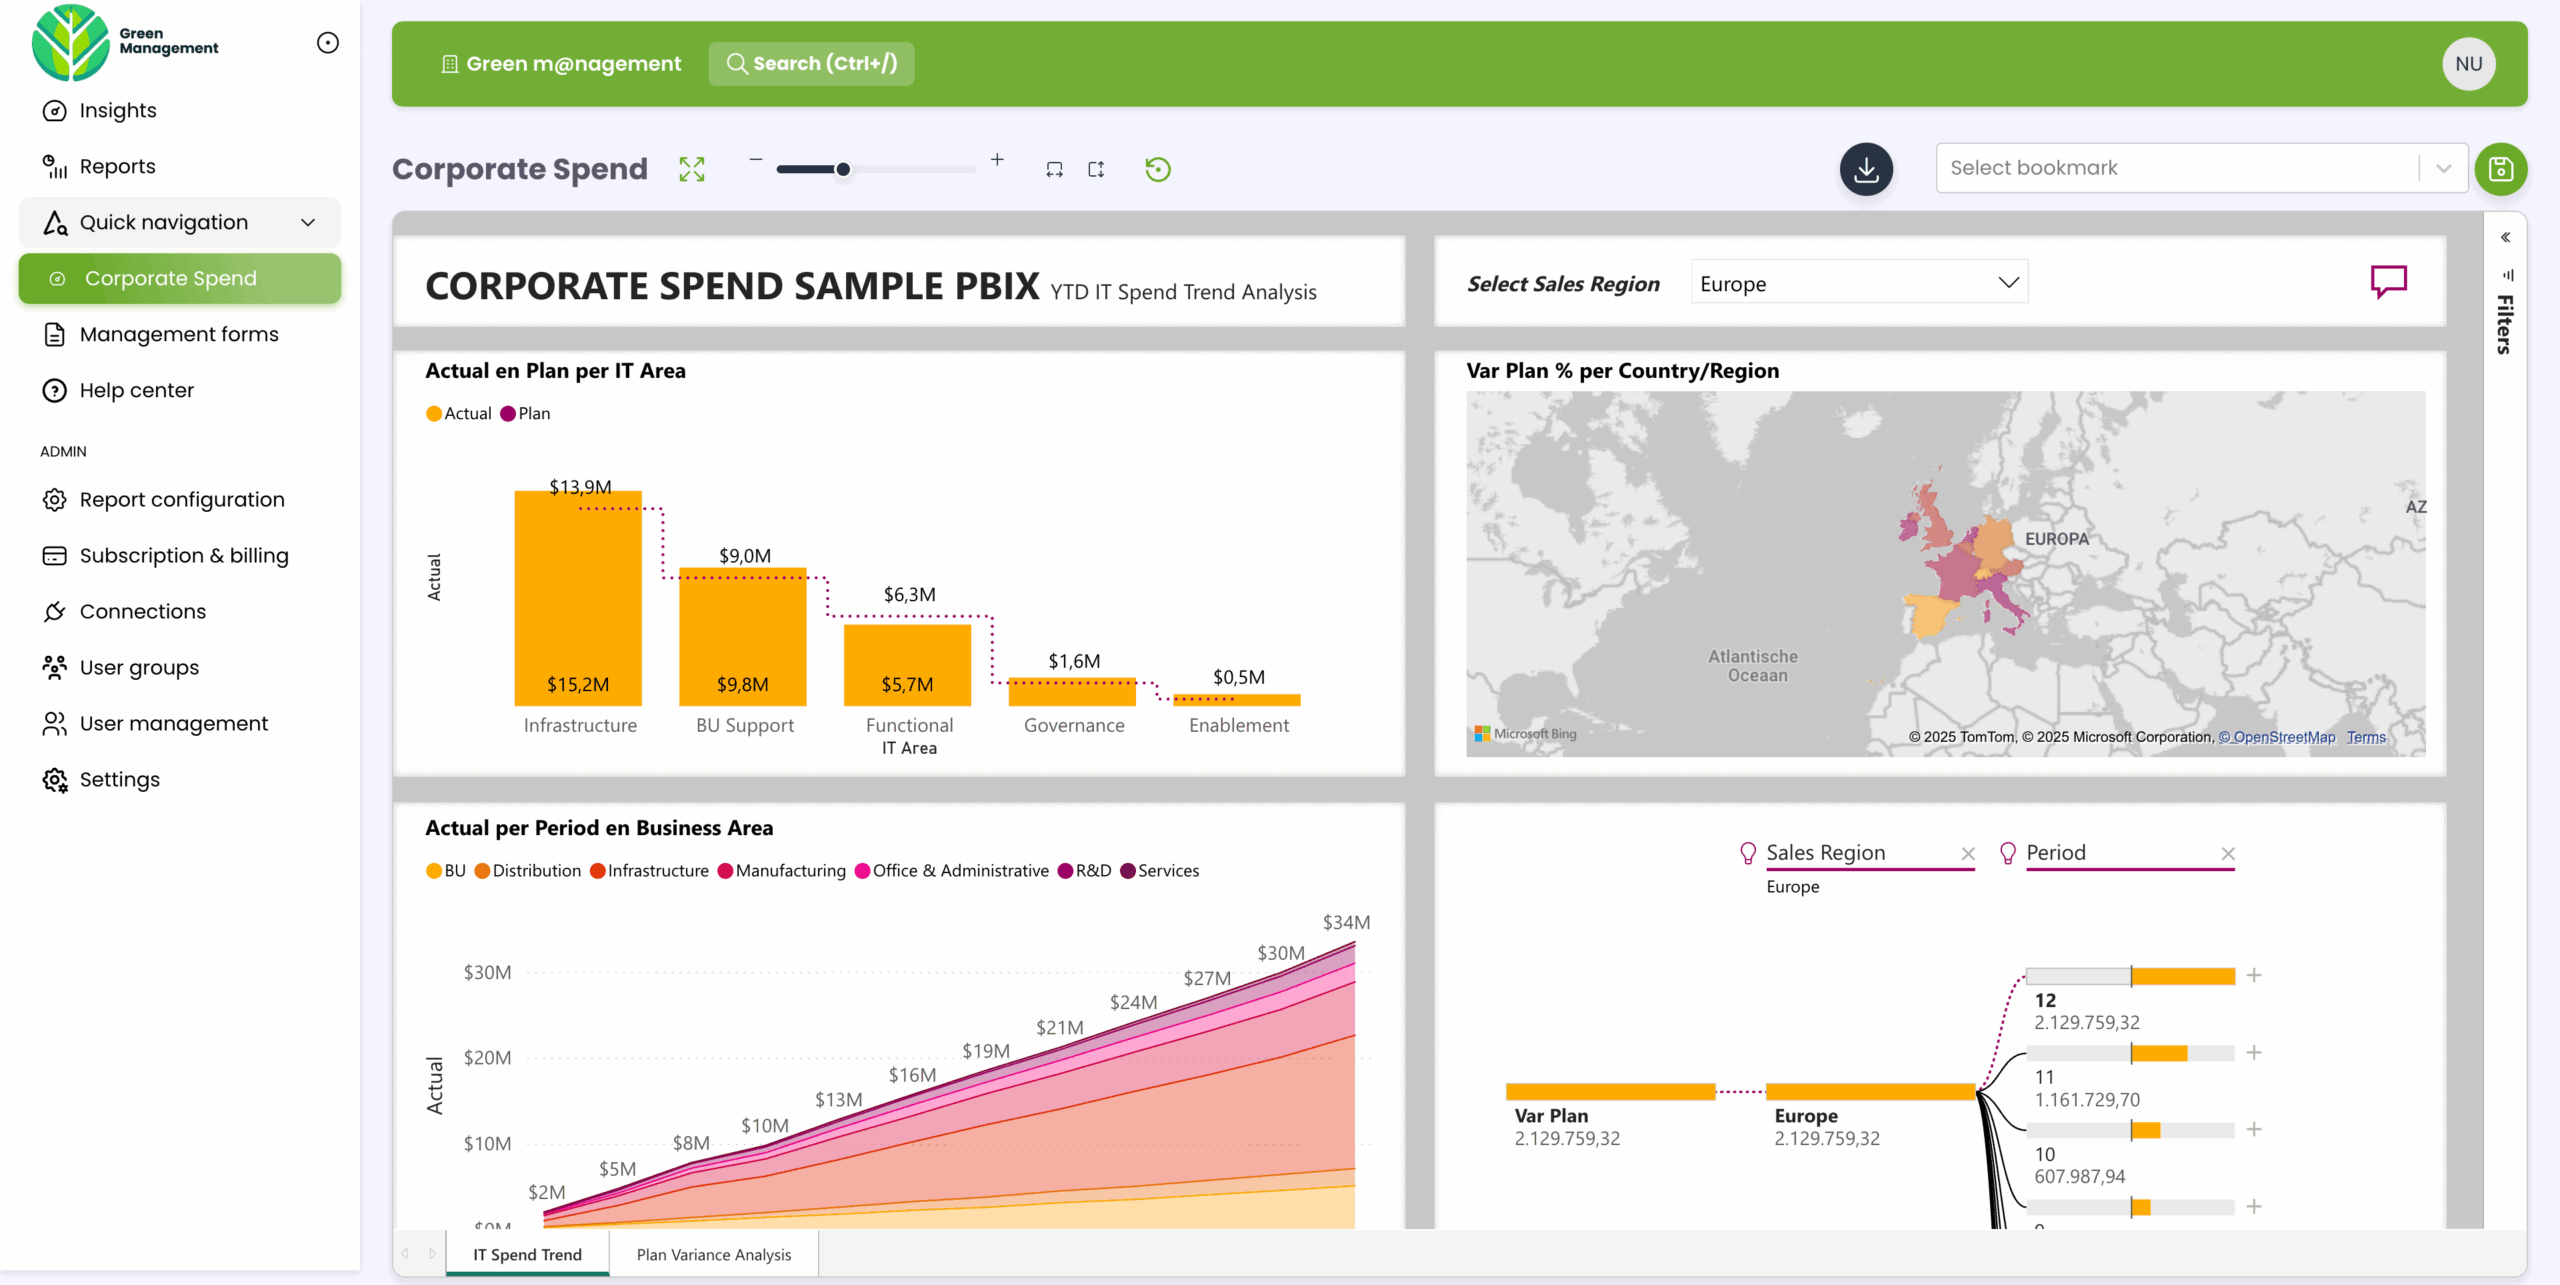
DataTako sits on top of Power BI Embedded and takes care of:
- The embedding infrastructure — token generation, refresh logic, error handling
- White-label branding — custom domain, your colors, your logo, no Microsoft chrome
- Multi-tenant security — Row-Level Security, sub-organizations, role-based access
- Predictable pricing — flat monthly tiers, not variable Azure capacity bills
Teams that would have spent four to six months building Power BI Embedded into their product are sharing branded reports with their first external users within 10 minutes of signing up. See how MeerMetData streamlined their client reporting.
DataTako doesn't replace Power BI — we're built on top of it. Your reports, models, and data stay in Microsoft's ecosystem. We're the platform layer that makes external-user analytics work.
Power BI vs Excel
Power BI and Excel aren't really competitors — they solve different problems.
Excel wins for one-off analysis, individual analyst work, datasets under ~1M rows, and maximum flexibility for ad-hoc calculations.
Power BI wins for shared dashboards consumed by many users, automated data refresh, governed analytics, row-level security, and large datasets.
In practice, most organizations use both. Analysts build initial logic in Excel, then promote successful analyses into Power BI for repeated, governed consumption. The transition is well-supported — Power BI reads Excel files, uses the same Power Query engine, and can embed Excel workbooks within reports.
Frequently asked questions about Power BI
Is Power BI free to use? Power BI Desktop is free. Sharing through Power BI Service requires a paid license — Pro, PPU, or being served by a Premium or Embedded capacity.
What's the difference between Power BI and Excel? Excel is built around individual spreadsheets you manually update. Power BI is built around a persistent, refreshing data model designed for shared dashboards. Most organizations use both.
Can I use Power BI without Microsoft 365? Power BI Desktop works standalone. Power BI Service requires a Microsoft account. Power BI Embedded can serve users with no Microsoft accounts at all — which is why it's the basis for SaaS analytics.
Is Power BI better than Tableau or Looker? For organizations already on Microsoft, almost always yes — price, ecosystem fit, and update velocity favor Power BI. Tableau remains popular for exploratory analysis; Looker for engineering-heavy teams.
Can I embed Power BI in my SaaS application? Yes, via Power BI Embedded. The technical implementation is significant, which is why platforms like DataTako abstract it away. See our Power BI Embedded guide.
How long does it take to learn Power BI? A few days for basic reports. Weeks to months for DAX proficiency. A year or more for operational expertise at scale.
What is Microsoft Fabric, and how does it relate to Power BI? Fabric is Microsoft's unified analytics platform launched in 2023. Power BI is now part of it. F-SKU capacities are the new recommended path for organizations using multiple Microsoft analytics tools. See our Microsoft Fabric breakdown.
Does DataTako replace Power BI? No — DataTako is built on top of Power BI. You keep your reports, models, and data in Microsoft's ecosystem; we add the delivery layer for external users.
Can I share Power BI reports with users who don't have a Microsoft account? Not through Power BI Service directly. The options are Power BI Embedded (build it yourself) or a platform like DataTako that handles it. Try a free trial →