
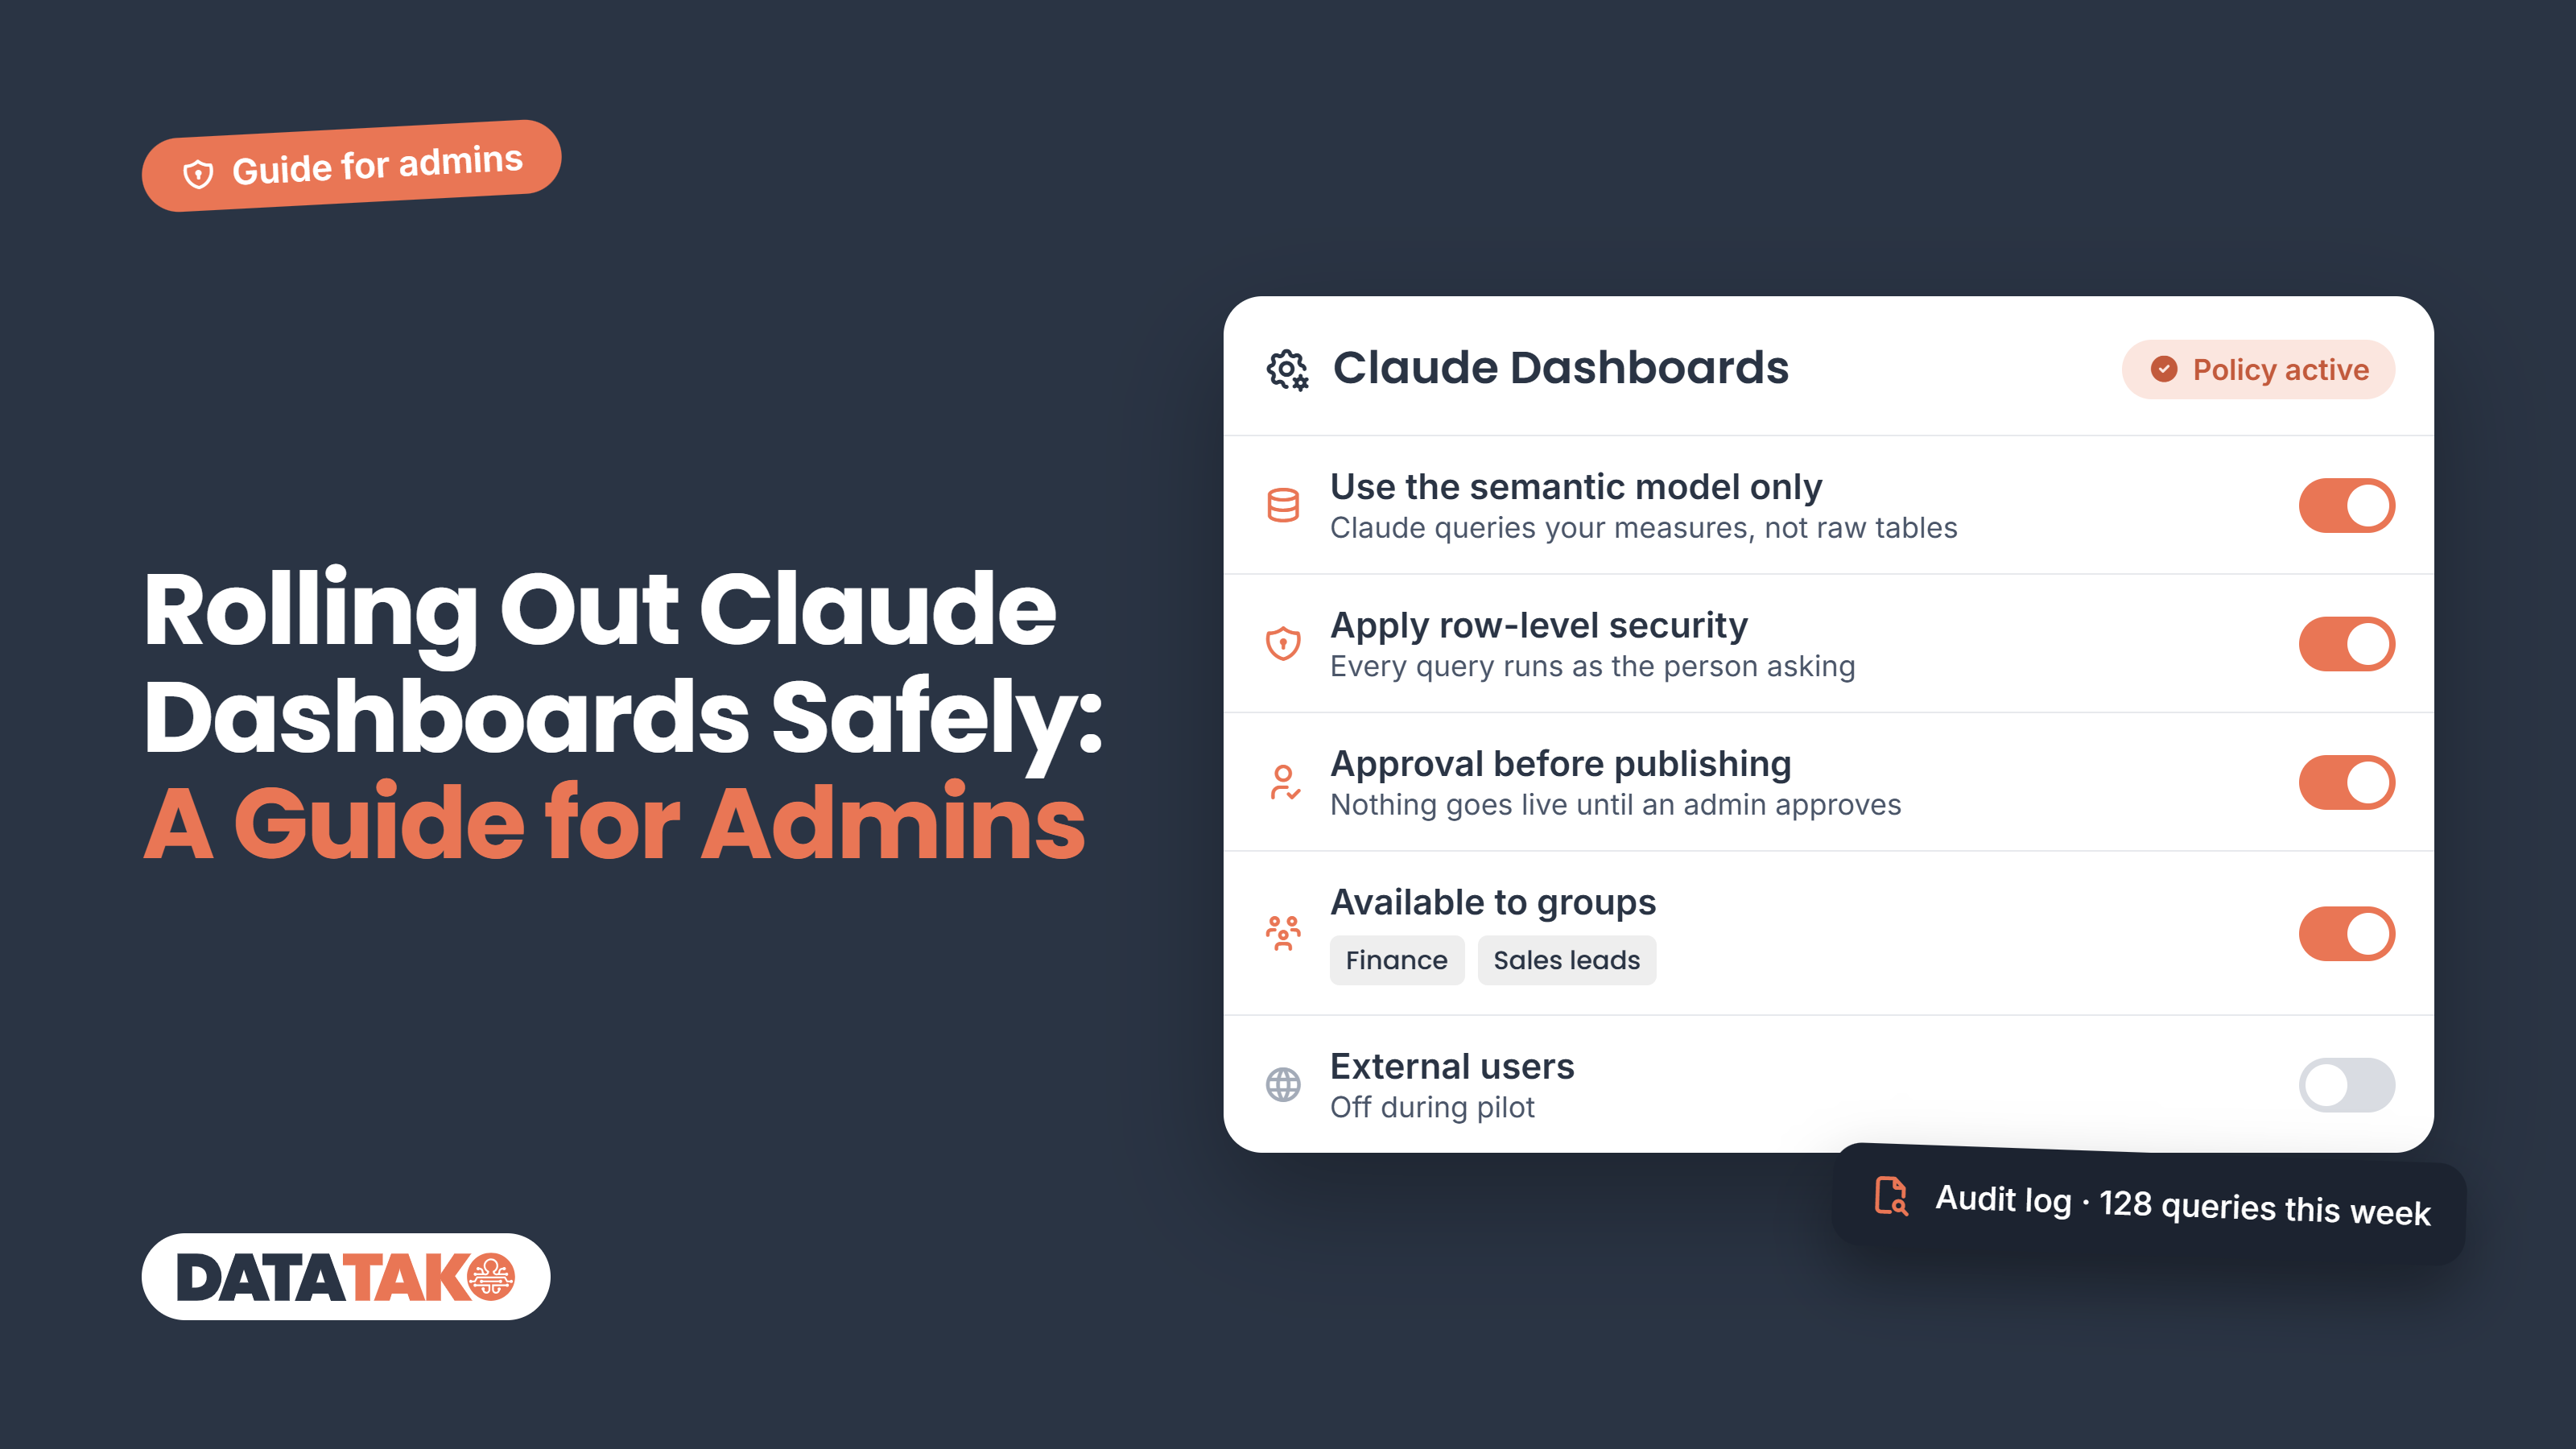
Short answer: rolling out Claude Dashboards safely comes down to three decisions. Which data sources people can connect, who can build and share dashboards, and where sharing stops. On Team and Enterprise you control this in Organization settings > Artifacts, with custom roles and groups on Enterprise. But there's one thing no setting fixes: a shared dashboard uses the viewer's own data connections. That works for colleagues. It doesn't work for clients, and that's where user management becomes the real question.
Your team has seen the demos. Someone types a question, Claude builds a live dashboard on Snowflake, and ten minutes later it's in the team channel. Now they want it too, preferably yesterday. As an admin, your job isn't to say no. It's to make sure the first dashboard that goes wrong doesn't leak data. This guide walks through the settings, the decisions and a rollout plan, step by step.
TL;DR
- It's off by default on Enterprise. An Owner turns it on under Organization settings > Artifacts. Cloud code execution and file creation must be on first.
- Connect read-only. Give dashboards a dedicated, read-only warehouse account with access to the tables people actually need.
- Scope who can build. On Enterprise, custom roles let you give the Dashboards capability to specific groups only.
- Keep external sharing off until you have a policy. Public links and email invitations outside your organization are separate toggles.
- Know the limit. Shared dashboards run on the viewer's own connections. External viewers without access to your warehouse see an error, not your data.
- For client-facing dashboards, use a portal. User management, row-level security and branding per client is what DataTako is built for.
How Claude Dashboards gets turned on
Claude Dashboards is a beta on Pro, Max, Team and Enterprise plans. For organizations, it sits behind a few switches. According to Anthropic's artifacts admin guide:
- Cloud code execution and file creation must be on, under Organization settings > Capabilities.
- Artifacts is the master switch, under Organization settings > Artifacts.
- Dashboards is a separate template toggle on the same page. On Enterprise it's off by default.
- Enable artifact connectors, under Capabilities > Visuals, lets dashboards pull from connected apps.
One detail to know before you flip anything: the connector setting is org-wide. You can't limit which connected apps artifacts can reach. Each user connects their own apps, so your control sits in which connectors exist in your organization and what those accounts can see.
Step 1: decide which data people can connect
A dashboard can only show what the connection behind it can read. That makes the data connection your most important control.
- Use a dedicated, read-only account. Don't let people connect Snowflake or BigQuery with their admin credentials. Create a service role for analytics with read access only.
- Apply least privilege. Expose curated views or a reporting schema, not raw tables with personal data.
- Keep sensitive data out. On HIPAA-ready organizations, Dashboards can be enabled, but it isn't covered by the BAA. Protected health information shouldn't go in.
- Watch extracts. Besides live queries, a dashboard can store data as file extracts. Tabular Editor's review points out that anyone who can open the dashboard can read those files. Row-level security doesn't apply to them.
- Point people to the semantic layer. If your KPIs are defined in a semantic model, connecting there keeps numbers consistent with your official reports.
Step 2: control who can build, view and share
This is where most of the risk sits. A dashboard is private until someone shares it, so the question is who can share it, and with whom.
Who can build. On Enterprise, custom roles (Organization settings > Roles) include a Dashboards capability. Give it to a pilot group first, not to everyone. The organization setting stays the top-level switch: if Dashboards is off org-wide, no role can turn it on.
Who can see. Claude's sharing options range from private, to specific people, to everyone in your organization. Enterprise can also share with groups. Access levels are Can view, Commenter and Can edit.
Where sharing stops. Three settings decide whether a dashboard can leave your organization:
Two details matter here. Artifacts that use connected apps can't be shared with "Anyone with the link" at all. And admins can review everything marked "Shared outside" and remove individual people.
The catch: viewers bring their own connections. A shared artifact that pulls from connected apps "uses the viewer's connections, not yours." If a viewer lacks access to the data source, that part shows an error. For colleagues with the same Snowflake access, that's fine and even safe. For anyone outside your warehouse, the dashboard simply doesn't work.
Step 3: check compliance and data handling
Before you scale beyond a pilot, check these with your security or legal team:
- Where data is processed. Data queried through Claude is processed by Anthropic. Check whether that fits your data residency requirements.
- Retention. Enterprise custom retention periods can cover artifacts. Unopened artifacts can be deleted after the period.
- Audit trail. The Compliance API records artifacts at the artifact level, including versions. Make sure it feeds your existing logging.
- Offboarding. Removing a user, including through your identity provider, removes their artifact access immediately. Good news, as long as provisioning is actually connected.
- Usage. Dashboards count toward each user's normal usage limits. Tell people up front, so a pilot doesn't end with a surprise bill or blocked users.
Step 4: roll it out in phases
- Pilot (2 to 4 weeks). One team, one read-only connection, sharing limited to the organization. Pick people who already ask the data team the most questions.
- Write short guidelines. One page: which sources to use, what not to connect, how to check a query, and when a dashboard should become an official report.
- Review what was built. Which dashboards are opened weekly? Which numbers didn't match official reports? That tells you where your semantic layer needs work.
- Scale by group. Add teams through custom roles, one group at a time.
- Decide on external sharing last. Only once you know what people build, and only with a clear policy for who may receive what.
Admin checklist
- Cloud code execution and file creation enabled
- Artifacts and the Dashboards template enabled in Organization settings > Artifacts
- Dashboards capability limited to a pilot group via custom roles (Enterprise)
- Dedicated read-only warehouse account with curated views
- No sensitive or regulated data in connected sources
- External sharing and outside email invitations off, or covered by a policy
- Compliance API connected to your logging
- Retention period set for artifacts (Enterprise)
- User provisioning and offboarding via your identity provider
- One-page guidelines shared with the pilot group
- Plan for client-facing dashboards: where do those live?
The part no setting fixes: user access for clients
Everything above works well for one audience: your own colleagues. They have Claude accounts, they're in your identity provider, and they can reach your warehouse. Client reporting breaks all three assumptions.
- Clients don't have your connections. A shared dashboard runs on the viewer's own data connections. Your client has no access to your Snowflake, so they see an error.
- Clients need their own slice of data. Client A must never see client B's numbers. That's row-level security per viewer, managed per client, not one sharing link.
- Clients need a Claude account. Even a public link requires viewers to sign in to Claude, and artifacts with connected apps can't use public links at all.
- Clients expect your brand. A client portal looks like your product, not like someone else's tool.
This is the user access and management problem DataTako is built for. Your data stays in Power BI, and DataTako handles who sees what:
- Sub-organisations per client. Each client gets their own users, groups, reports and activity, separated from every other client. (How sub-organisations work.)
- User and report groups. Assign access once to a group, and it applies to every viewer in it. An assignment overview shows who has access to what in one matrix, exportable to Excel.
- Row-level security mapped to users. Power BI RLS roles are mapped to users and groups, and applied to every view, alert and AI answer.
- Sign-in your way. Single sign-on with Microsoft or SAML 2.0, Entra ID sync, two-factor authentication and IP whitelisting.
- Bulk onboarding. Import users from Excel and assign them to groups in one go.
- White-label per client. Your domain, colours, logo and sign-in page, with branding per sub-organisation.
- No Power BI Pro licence per viewer. Clients log in to the portal, not to Microsoft.
And you don't have to give up AI-built dashboards for it. In DataTako, an AI app like Claude can build a fully custom data dashboard on your semantic model. That dashboard uses the same access management as your reports, so each client only sees their own data. (Creating Power BI dashboards with AI explains how.)
So the split is simple. Claude Dashboards for your internal team, governed with the settings in this guide. DataTako for everyone outside it, governed per client.
Frequently asked questions
How do I turn on Claude Dashboards for my organization?
An Owner or Primary Owner enables it under Organization settings > Artifacts. Cloud code execution and file creation must be on first. On Enterprise, Dashboards is off by default.
Can I limit Claude Dashboards to certain teams?
Yes, on Enterprise. Custom roles under Organization settings > Roles include a Dashboards capability, which you can assign to specific groups. The organization-wide setting must be on for any role to use it.
Can I control which data sources dashboards use?
Not per connector. Artifact connectors are switched on or off org-wide, and each user connects their own apps. Control it through which connectors your organization allows and what the connected accounts can read.
Can I share a Claude dashboard with external clients?
Only if an Owner enables external sharing or outside email invitations. Even then, dashboards that use connected apps run on the viewer's own connections, so clients without access to your data source see an error. For client reporting, a portal with per-client user management, like DataTako, is the better fit.
Is Claude Dashboards suitable for sensitive data?
Be careful. Data extracts in a dashboard can be read by anyone who can open it, and Dashboards isn't covered by Anthropic's BAA for HIPAA. Use read-only connections to curated data and keep regulated data out.

