
Describe the dashboard. AI builds it. You publish it.
Data dashboards are built directly on your Power BI semantic model. Every measure, relationship and data quality rule your team already maintains is ready to use. Tell your AI app what you want to see, check the draft in DataTako and publish it to your portal, where every viewer sees their own numbers.
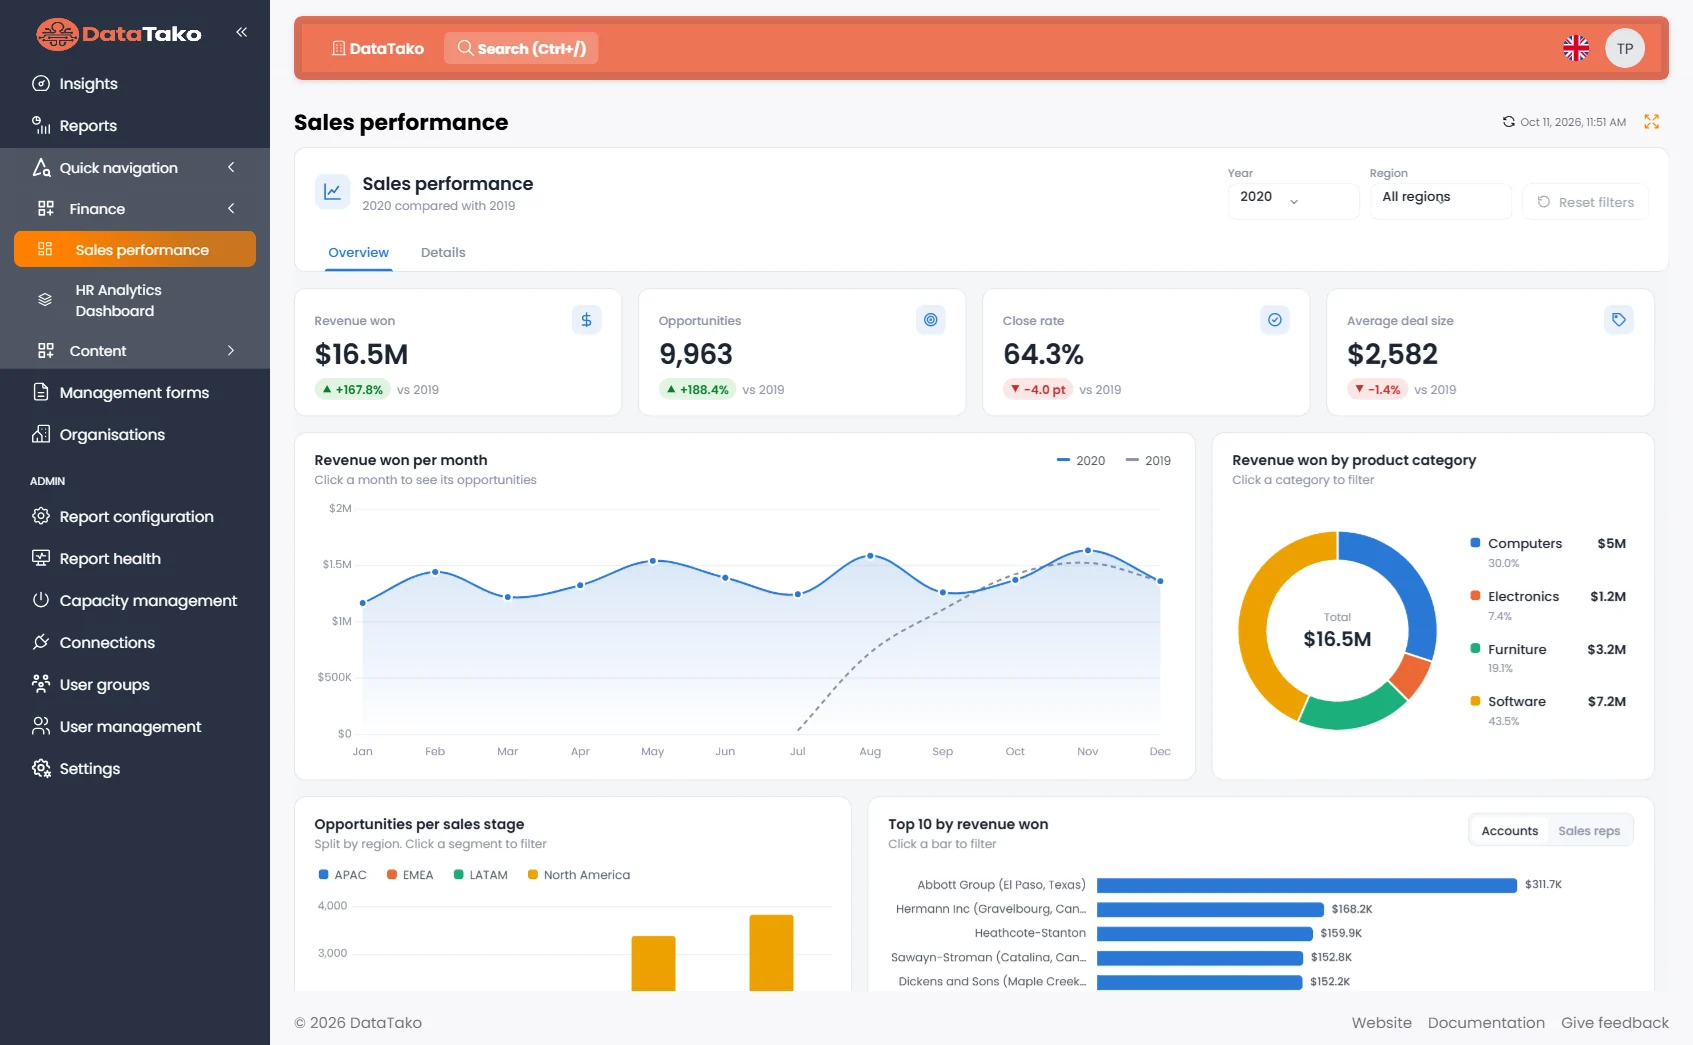
Every measure you trust, ready for every dashboard
Data dashboards query your Power BI semantic model directly. The measures, calculations, relationships and data quality work your team already invested in are the foundation. No exports, no copies, no second version of the truth.
Your measures, not new formulas
Revenue, margin and every other KPI come straight from the measures in your model, so the numbers match your reports.
One version of the truth
Dashboards query the live model, with the definitions, validations and data quality rules you already maintain.
As deep as your model goes
Multi-page analyses, drill-downs to transaction level, period and segment comparisons: anything your model can answer.
Always current
Every dashboard shows the latest refresh of your model, with optional auto-refresh and a refresh button for users.
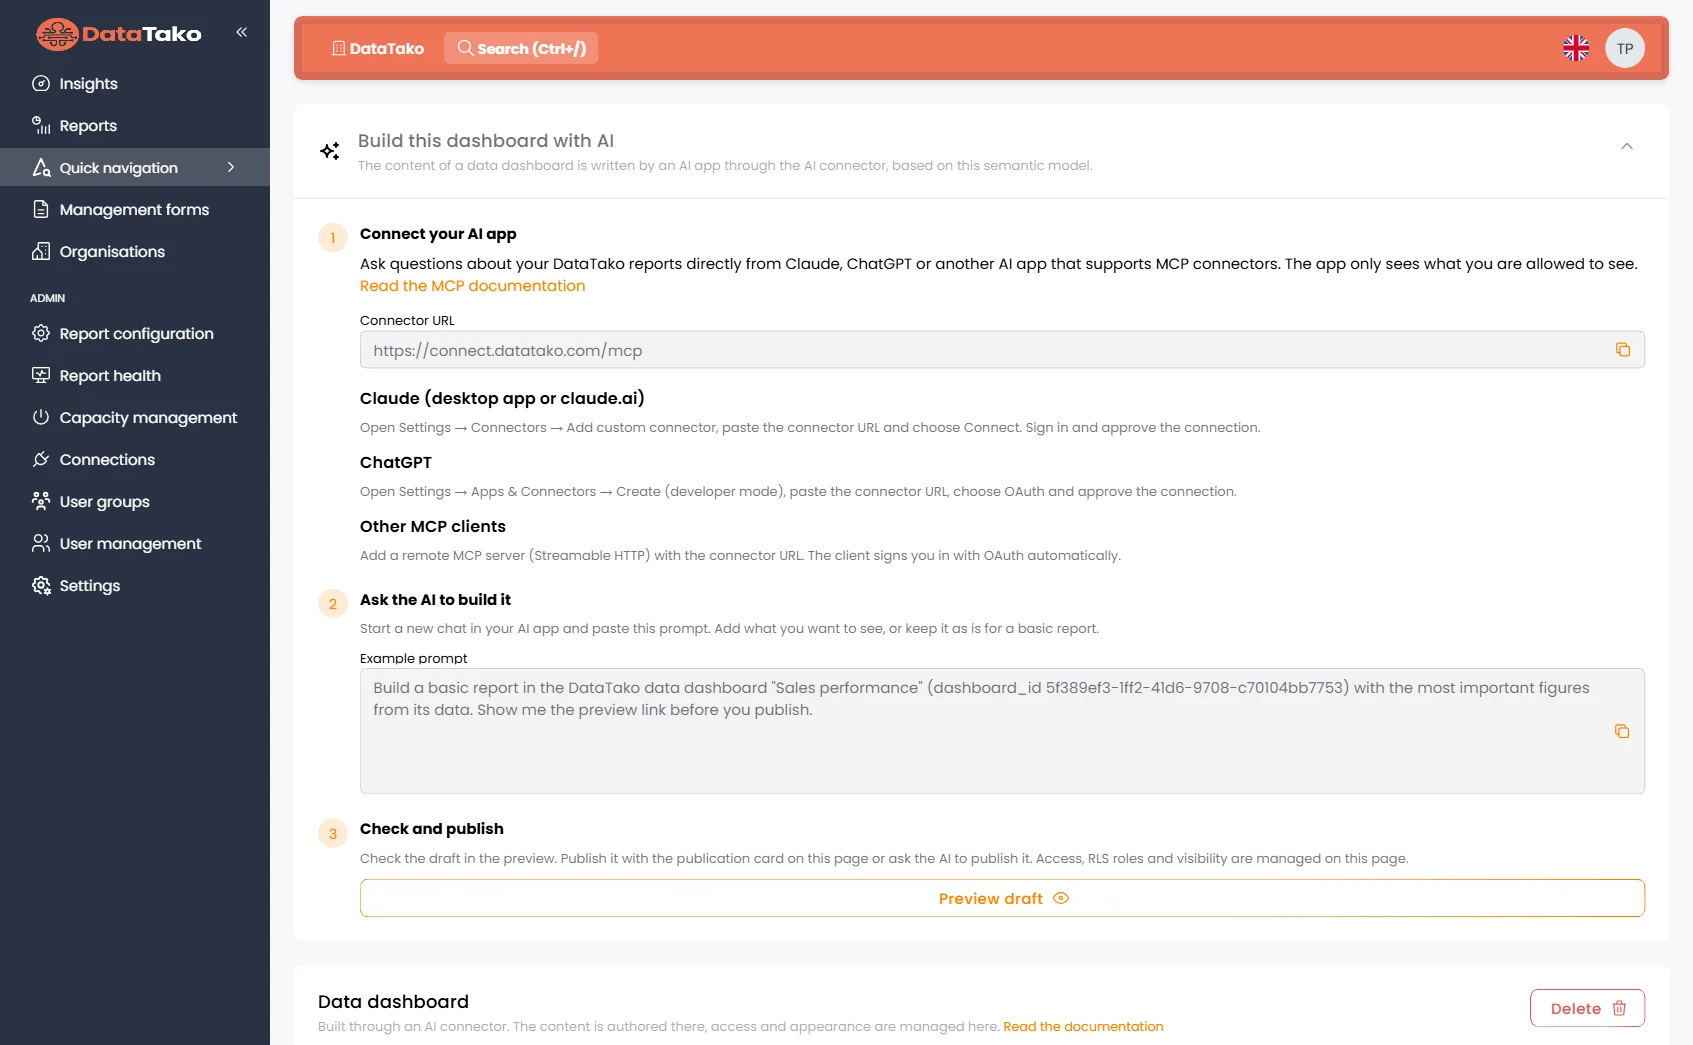
From prompt to portal in four steps
Create it in DataTako
Choose the semantic model and who gets access.
Ask your AI app to build it
Paste the example prompt and say what you want to see.
Check the draft and publish
Ask for changes until it's right, then publish.
Users open it like any report
In the same portal, under their own access.
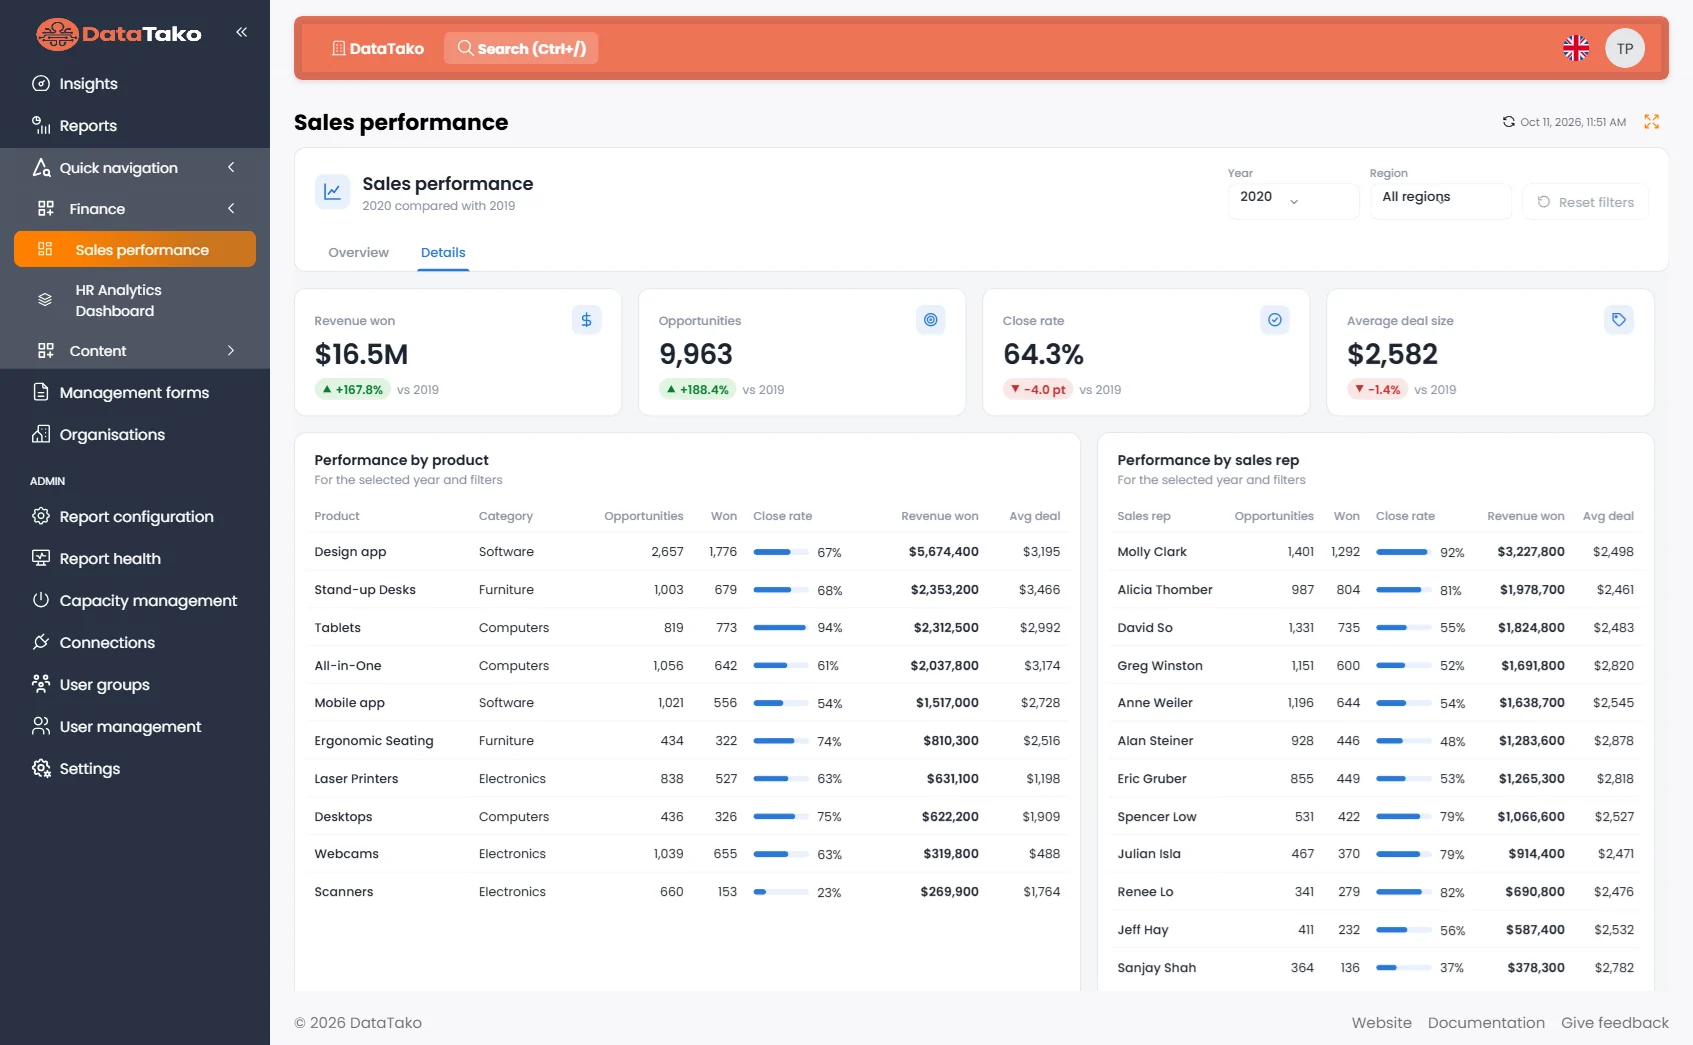
Not limited to standard visuals
A data dashboard is a web page on your model, so AI can build exactly what you describe.
New insights without a new Power BI project
A new dashboard used to mean a ticket, a report developer and weeks of waiting. Now the people who need the insight describe it, and your governed semantic model does the rest.
Clear the dashboard backlog
Your analysts and consultants turn a question into a published dashboard in one conversation. Your BI team keeps ownership of the model, not of every view on it.
A tailored experience for every client
Give each client, team or audience a dashboard built for them, in your branded portal, without creating and maintaining yet another Power BI report.
No extra licenses, no AI credits
Viewers don't need a Power BI license, and the AI work runs on your own AI subscription. Dashboards query the capacity you already have.
Governed from draft to publish
Nothing goes live without approval. Preview every draft as a specific RLS role, publish when it's right, and manage access like any report.
Just say what you want to see
Questions about data dashboards
Which semantic models can I use?
Any semantic model in a Power BI workspace connected to DataTako. The dashboard uses the model's own measures and relationships, and every viewer sees the data their row-level security roles allow.
Can users see the dashboard before it's finished?
No. Everything AI builds goes into a draft. Users only see the version you publish.
Are there limits?
A dashboard uses one semantic model. A query returns up to 10,000 rows, and a dashboard can have up to 50 queries. For large data, let the AI summarise in the query, for example per month.
Do I need AI apps for data dashboards?
Yes. Data dashboards are built through an AI app connected to DataTako, so both features need to be switched on.
Which plan do I need?
Data dashboards are available on Scale and Enterprise.
Can I change a dashboard later?
Yes. Ask your AI app for changes. They go into a new draft until you publish them.
Build your first data dashboard
Connect your AI app, pick a model and describe what you need.