
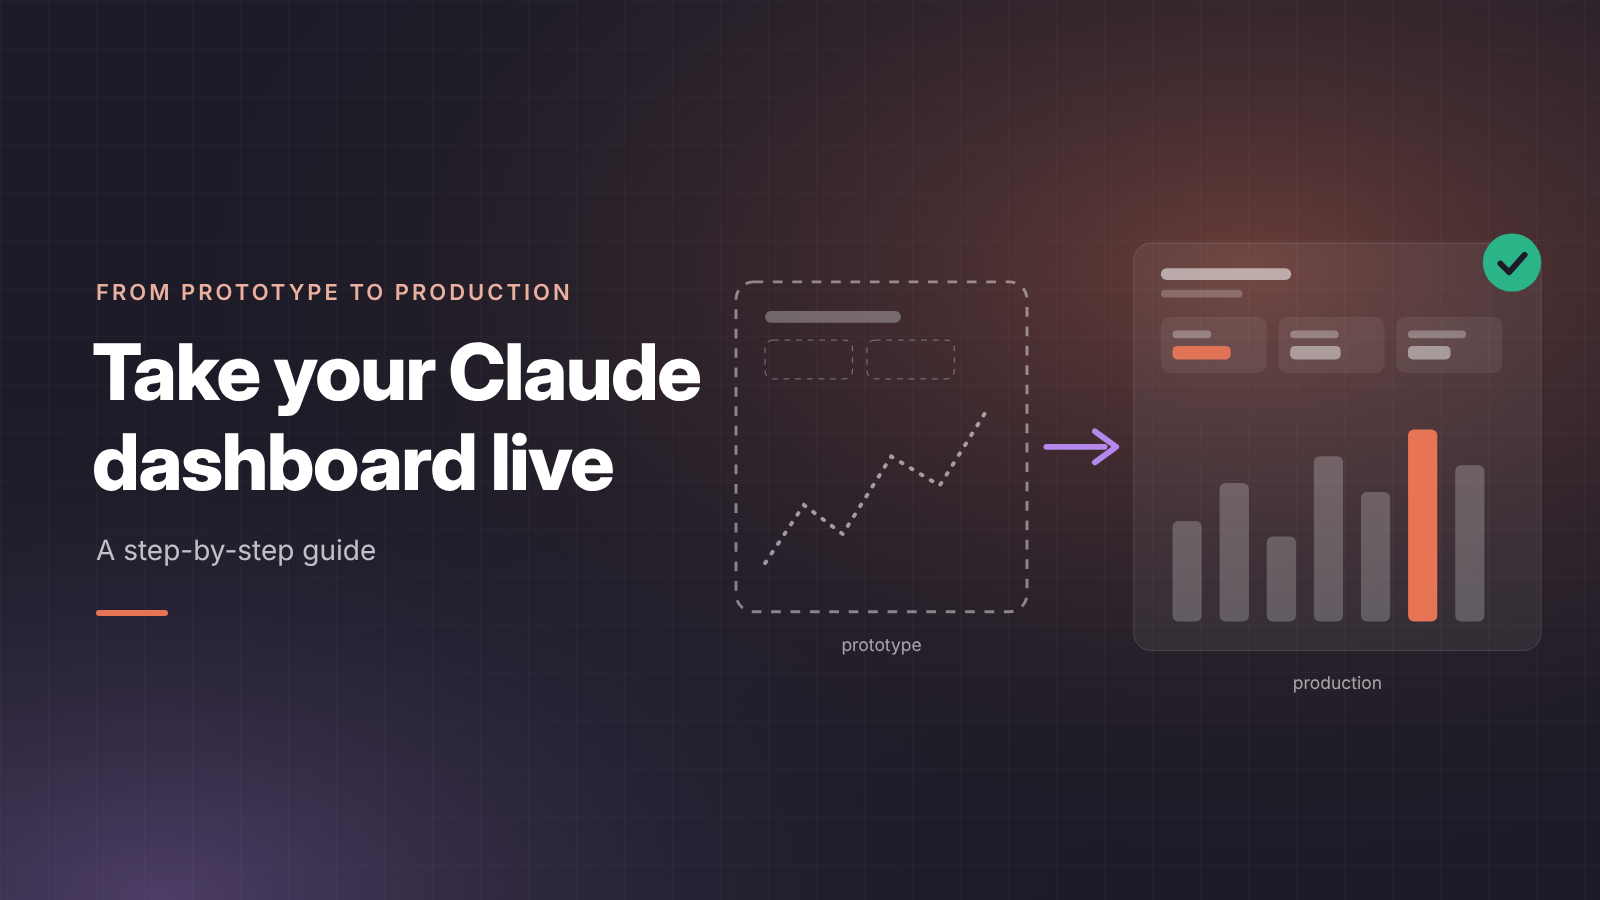
Short answer: a Claude dashboard is a great prototype, but it is not built for a large audience. It has no source control, it often runs on an extract, and every viewer needs a Claude account. To take it to production, rebuild it on your governed semantic model, give each viewer only their own data, version every change, and publish it where your users already log in.
- Keep the prototype as the spec: the questions it answers and the charts people actually use.
- Rebuild on the semantic model, so the dashboard uses the same measures as your reports.
- Test row-level security as each role before anyone sees it.
- Publish versions, not edits, so you can roll back.
- Embed it where users work and log who opens it.
Signs your prototype is ready for production
Not every AI dashboard needs to grow up. Move it to production when two or more of these are true:
- More than a handful of people open it every week.
- People outside your team or company ask for access.
- Different viewers should see different data, such as one client or one region each.
- Decisions or client conversations rely on its numbers.
- You have been asked twice why its figures differ from the Power BI report.
- It has been online longer than the meeting it was built for.
As Tabular Editor notes, Claude dashboards suit ad-hoc analysis and small teams; for broad audiences, the prototype should become a governed report.
Step by step: from Claude dashboard to published portal dashboard
This is the route with DataTako data dashboards. You keep working in Claude or ChatGPT; only the data source and the publishing change.
- Write down what the prototype proves. List the questions it answers, the KPIs, filters and drill-downs people use. Drop the charts nobody looks at. This list becomes your prompt.
- Check the semantic model. Make sure every KPI exists as a measure in your Power BI model. If the prototype computed something in its own SQL, add it as a measure first, so the numbers match your reports.
- Turn on AI apps and data dashboards. An admin enables both under Settings → Features (Scale or Enterprise plan).
- Create the dashboard in DataTako. Choose the workspace and semantic model, the report group, and who gets access, with their RLS roles. The model cannot be changed later.
- Connect your AI app and build. Add the DataTako connector to Claude or ChatGPT and paste the example prompt from the dashboard page, plus your list from step 1. The AI saves its work as a draft and returns a preview link.
- Iterate on the draft. Ask for changes in the same chat and reload the preview. Users cannot see drafts.
- Preview as each RLS role. Pick roles in the preview banner and check that each one sees only its own rows. Note that dynamic RLS based on the signed-in user is not supported yet.
- Publish with a change note. Each publish creates a version. Later edits go to a new draft, and you can restore an earlier version if something breaks.
- Retire the prototype. Remove the old Claude share link and any extracts it holds, so there is one version of the truth.
Limits to plan for: one semantic model per dashboard, up to 10,000 rows per query and 50 queries per dashboard. Summarise in the query, by month for example, rather than loading raw rows.
Embedding the dashboard in your website or app
Users adopt a dashboard faster when it sits where they already work. A published data dashboard can be embedded with an iframe, on all DataTako plans (docs).
Useful options: hide the title and action buttons so it blends into your page, hide it from the portal overview so it only lives in the embed, and pass URL parameters as filters (for example a project ID). Public embeds can get an active-from and active-until date, and regenerating the link cuts off every old copy.
SharePoint: paste the iframe code into an Embed web part on a SharePoint page.
Microsoft Teams: Teams does not accept raw iframe code. Instead, add a tab to a channel or chat with +, choose Website, and paste the Embed URL (the src from the iframe code). Teams then loads the dashboard inside the tab (Microsoft: Teams tabs).
A native Microsoft Teams integration for DataTako is in development.
Audit: seeing who viewed what
In production, you need to answer two questions fast: who has access, and who actually opened it. That matters for client trust, for a GDPR access request, and for cleaning up dashboards nobody uses.
- Access is explicit. Every dashboard lists the users and groups it is shared with, and their RLS roles.
- Activity is visible. DataTako admins can see who logged in and what they viewed.
- AI use is logged. The AI apps activity log shows which user, app, report or form was used, without storing questions or results. Connections can be revoked and expire after 90 days unused.
- Changes are versioned. Each publish is a version with an optional note, so you can see what changed and roll back.
- Audit logs and compliance reports are part of the Enterprise plan.
Activity logs are kept for 12 months and can be exported, so you can answer a client question or an access request about the past year, or feed the log into your own monitoring.
Production readiness checklist
- Every KPI comes from a measure in the semantic model, not from dashboard-specific SQL.
- No extracts, uploaded files or hard-coded numbers in the dashboard.
- Access is set per user or group; no "anyone with the link" for non-public data.
- The draft was previewed as each RLS role, including a role that should see nothing.
- Queries summarise data and stay under the row and query limits.
- Refresh schedule and "last refreshed" time are set.
- Published with a change note; you know how to restore the previous version.
- Embedded where users work, with title and buttons hidden if it lives inside another app.
- An owner is named, and a review date is in the calendar.
- The original prototype link and its data are removed.
FAQ
Can I export a Claude dashboard to Power BI? No. Claude dashboards cannot be exported to Power BI or Fabric, and there is no project code to download. You rebuild it, ideally by prompting an AI app against your semantic model.
Do I have to learn Power BI to do this? No. With DataTako you keep describing the dashboard to Claude or ChatGPT. The difference is that it queries your semantic model and is published in your portal.
Can I roll back a bad change? Yes. Each publish creates a version, and you can republish an earlier one in one click or ask the AI app to restore it.
Can clients see the dashboard without a Claude account? Yes. They sign in to your DataTako portal or the app where you embedded it.
Does it work with dynamic row-level security? Not yet. Models with roles based on the signed-in user, such as USERPRINCIPALNAME, are blocked for data dashboards. Static RLS roles work.
Can I embed a dashboard on a public website? Yes, with a public embed, but only for models without RLS and for data anyone may see.
Conclusion
A Claude dashboard proves what people want to see. Production is about who may see it, whether the numbers match your reports, and whether you can roll back. Rebuild on your semantic model, test every role and publish in versions. See how DataTako data dashboards work.

