
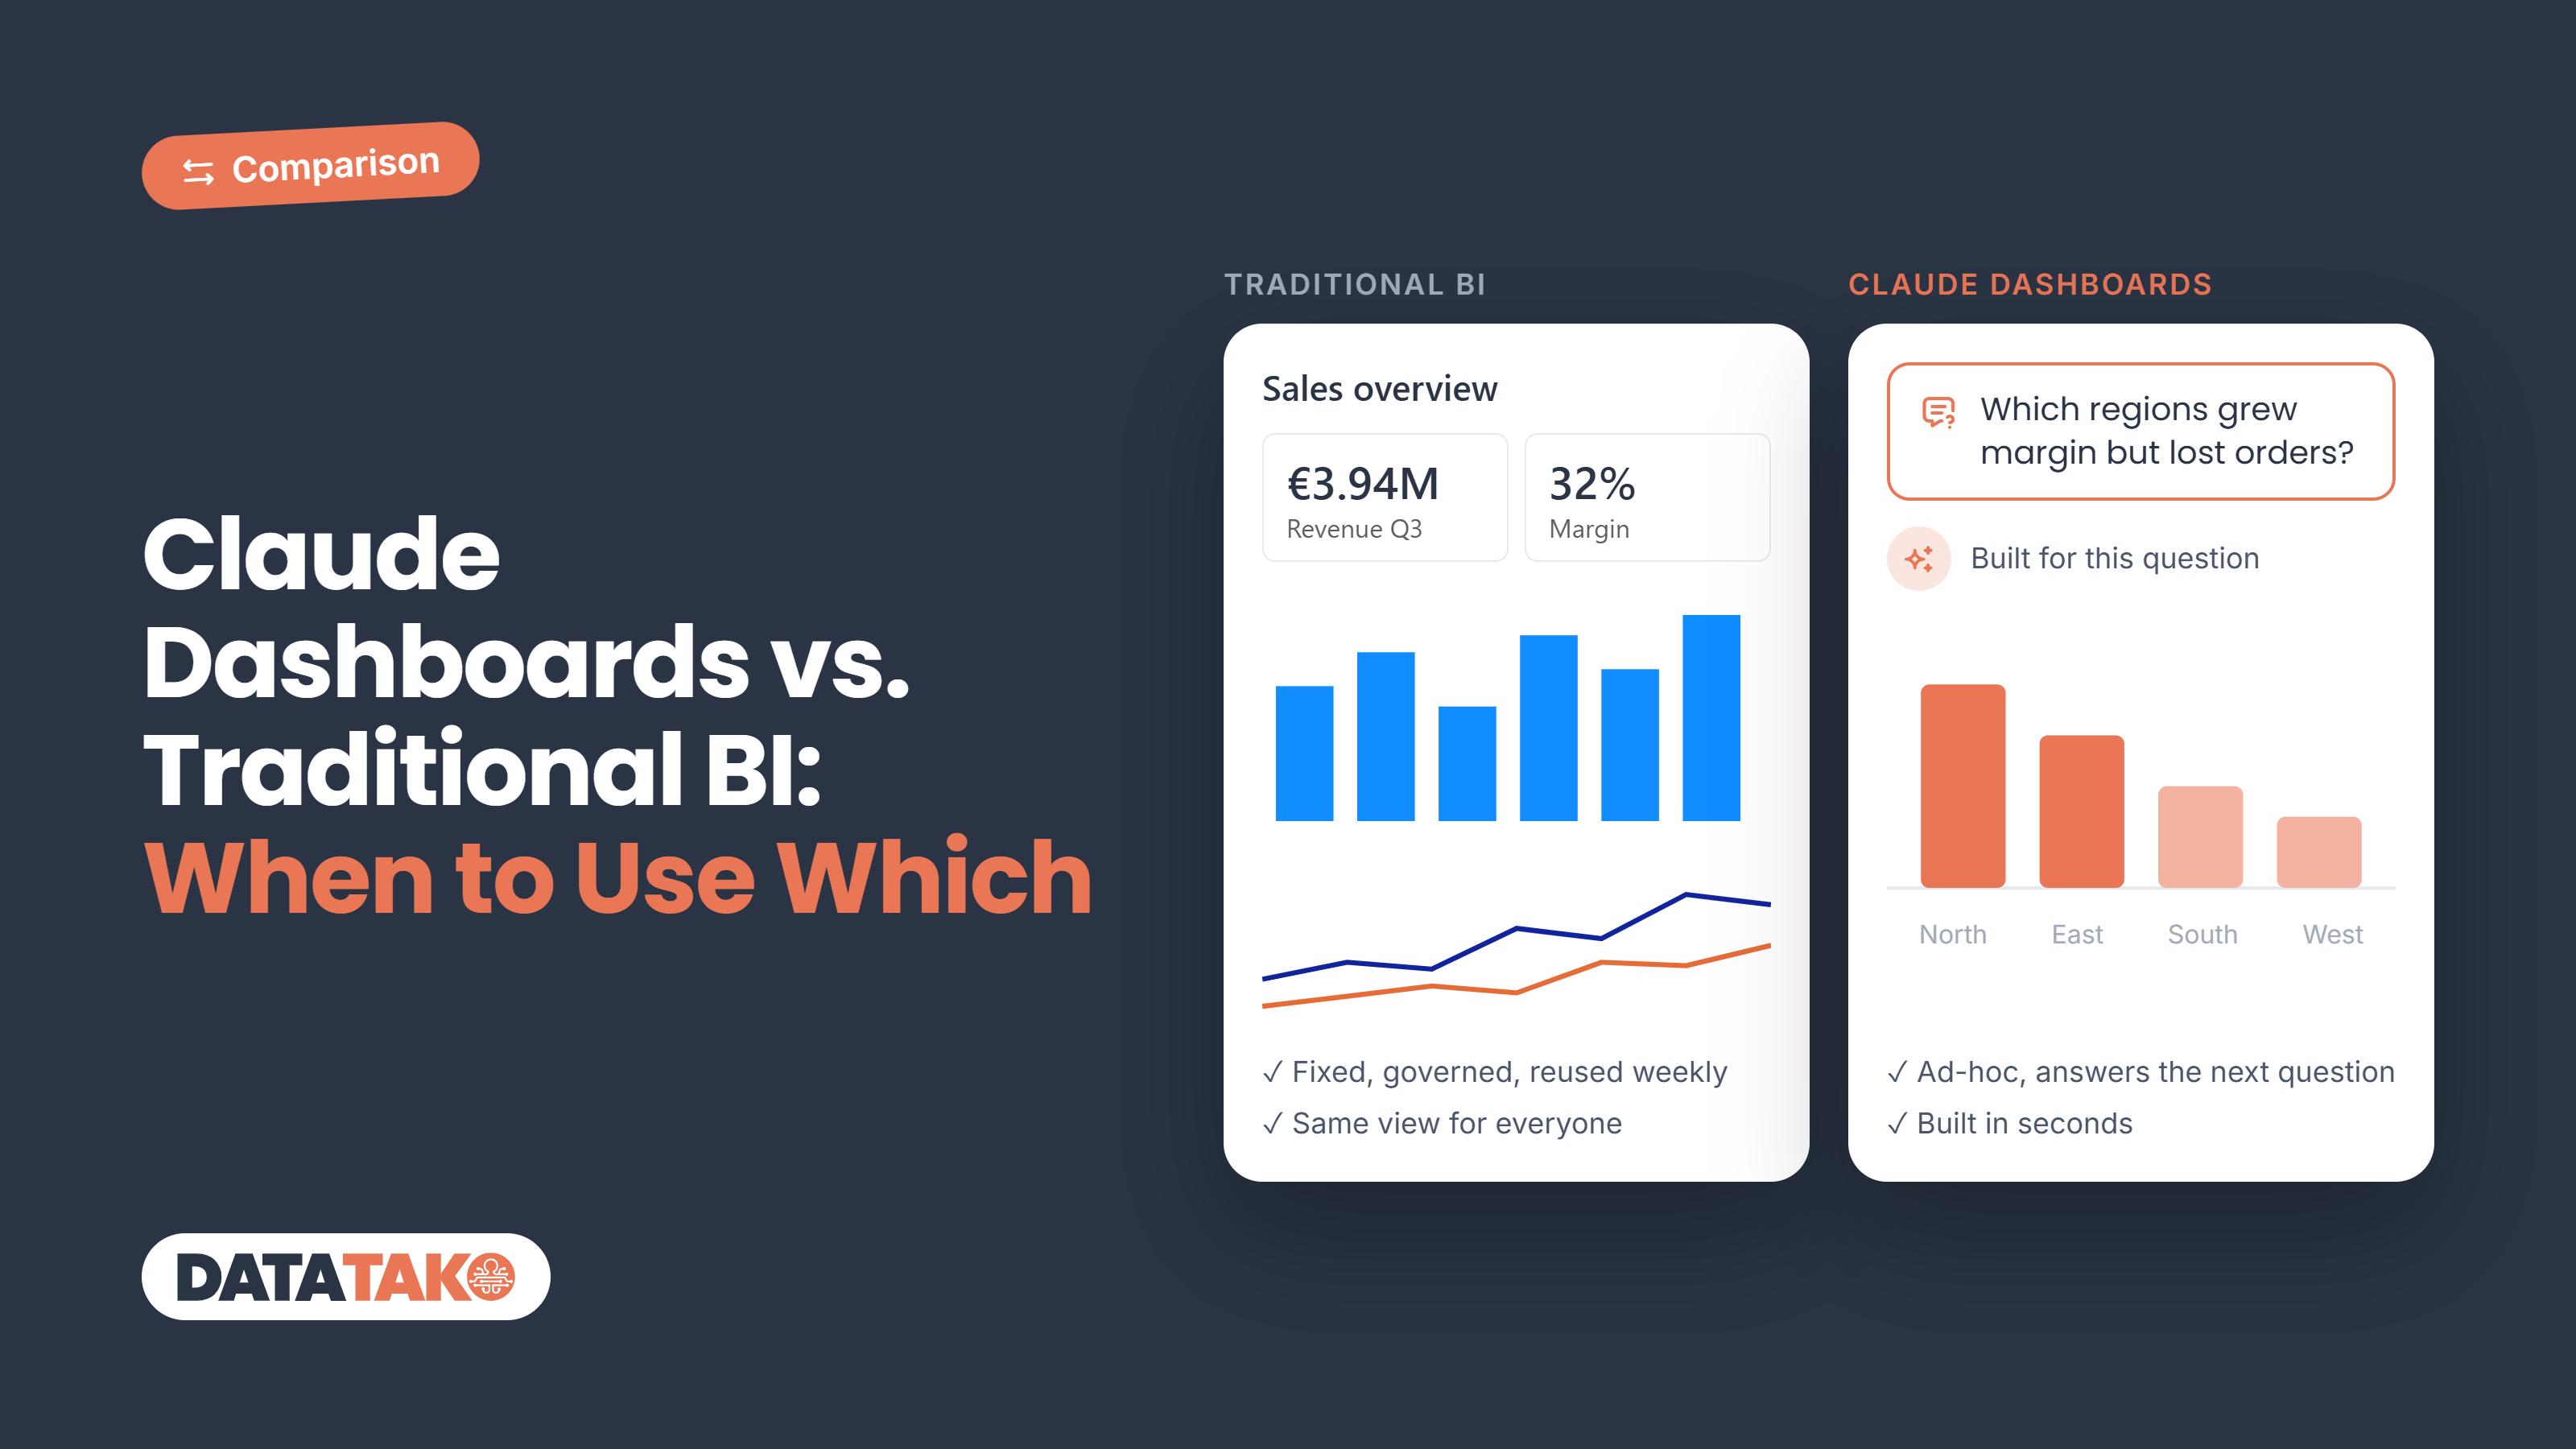
Short answer: use Claude Dashboards for fast, exploratory questions on data you already trust, and keep traditional BI like Power BI for governed metrics, long-lived reports and anything you share with clients. Claude Dashboards went into beta on 8 October 2026. It turns a plain-language question into a live dashboard and shows the SQL behind every number. But it's built for quick answers, not for replacing your semantic model, your row-level security or your client portal.
Since the launch, one question keeps landing in our inbox: "Do we still need Power BI?" It's a fair question. You type what you want to see, Claude writes the queries, and a few minutes later you have a working dashboard. Compare that to a week in the report queue. But speed is only half the story. The other half is who can see the result, whether the numbers match your official ones, and whether it still works in six months. Here's where each one wins, honestly.
TL;DR
- Claude Dashboards builds a dashboard from a question. It runs SQL against a connected source like Snowflake, BigQuery or Databricks, and shows the query and refresh time for every chart.
- It's a beta, and Anthropic positions it for exploration. Its own words: dashboards "work alongside your BI and analytics tools."
- Traditional BI still wins on governed measures, row-level security, version control, large audiences and dashboards that need to last.
- The best setup is usually both. Explore in Claude, then promote what sticks to your BI stack.
- For external clients, neither one solves sharing by default. That's still a portal problem, and it's where DataTako comes in.
What is Claude Dashboards, actually?
Claude Dashboards is a new artifact type in Claude. You ask a question in chat, for example "show me weekly revenue by region for the last six months", and Claude builds a dashboard around it. According to Anthropic's help article, "Claude writes a SQL query for each chart and runs it against your data source."
A few things are worth knowing up front:
- It connects through Claude connectors. Anthropic names Amazon Redshift, BigQuery, ClickHouse, Databricks and Snowflake, plus apps like Salesforce.
- Every number is traceable. Click a chart and you see its query and when the data was last refreshed. You can also ask Claude to explain how a number was calculated.
- It's private until you share it. Teammates can work on the same dashboard, and admins decide whether it can be shared outside the organization.
- You can hand it off. Dashboards can be sent to tools like Hex, Sigma, Mixpanel and Grafana. Looker and Tableau are listed as coming soon.
- It's a beta on paid plans. Pro, Max, Team and Enterprise. On Enterprise it's off until an owner turns it on.
What about Power BI? There's no ready-made Microsoft connector for Claude yet. Tabular Editor tested it and got live DAX queries working through Microsoft's Power BI MCP server, added as a custom connector. That works, but it takes an Entra app registration, a Fabric tenant setting and the model's ID. It's not a click-and-go setup.
Where Claude Dashboards shines
The best use case is the question nobody built a report for. Someone in sales asks why churn went up in Q3, and instead of a ticket, they get a dashboard the same afternoon.
- Ad-hoc questions. One-off analyses that would never justify a week of BI work.
- Speed. Describing a dashboard takes minutes. Changes are a message in a chat, not a request in a queue.
- No BI skills needed. Product managers, marketers and finance people can explore data without learning DAX or SQL.
- Transparency. Because you can open the query behind every number, it's easier to check than most AI output.
- Prototyping. It's a fast way to find out what a dashboard should look like before a BI team builds the real thing.
Where traditional BI still wins
Here's where teams get stuck. A dashboard built in a chat is quick, but it isn't automatically the official version of the truth.
- Governed metrics. In Power BI, "revenue" is one measure in the semantic model that every report uses. Claude writes its own query per chart, and calculations on the page run as JavaScript, not against your model. Two dashboards can end up with two definitions of the same KPI.
- Row-level security. Power BI filters data per viewer with RLS roles. Claude Dashboards can use live queries that run with each viewer's own connection, but data extracts saved in a dashboard can be read by anyone who can open it.
- Ownership and version control. Power BI reports can live in git and move through dev, test and production. A Claude dashboard lives in a Claude account, and you can't export the code.
- Scale and lifespan. Reports for hundreds of users that need to run for years are what BI platforms are built for. A Claude dashboard is, in Tabular Editor's words, "transient by default, born from a chat".
- Pixel-perfect and paginated reporting. Invoices, board packs and regulatory reports still belong in a BI tool.
- Compliance. Data queried through Claude is processed on Anthropic's infrastructure, and artifacts aren't available in organizations with zero data retention enabled. For some industries, that's a showstopper.
Side by side
The hybrid approach: explore in Claude, standardise in BI
Most teams won't pick one. They'll use both, and that's exactly how Anthropic positions it. A workflow we see working:
- Explore in Claude. Anyone with access asks questions and builds quick dashboards on the warehouse.
- Spot what sticks. If a dashboard gets opened every week, it's no longer ad-hoc. It's a report.
- Promote it to BI. Rebuild it on the semantic model, with governed measures and RLS, and use the Claude version as the prototype.
- Keep the semantic model as the source of truth. Whatever tool builds the dashboard, the definitions of your KPIs should live in one place.
The last step matters most. AI doesn't replace a good data model. It makes a good data model more valuable, because every question anyone asks lands on the same trusted numbers.
When to use which: a quick checklist
Use Claude Dashboards when:
- The question is new, and you're not sure it will come back.
- You need an answer today, not next sprint.
- The audience is you or a small internal team.
- Your data sits in a warehouse Claude can connect to.
- You want a prototype before you commit BI time.
Use traditional BI when:
- The numbers are official KPIs that need one shared definition.
- Different viewers must see different data (RLS).
- The dashboard needs to run reliably for months or years.
- You need version control, deployment pipelines or audit trails.
- The audience is large, or outside your organization.
What about dashboards for your clients?
This is the gap neither option closes on its own. Claude Dashboards is built for people inside your organization, and sharing outside it depends on your admin settings. Power BI can reach external clients, but only with a Pro licence per viewer, a large capacity, or embedding.
That's the problem DataTako solves. Your semantic models, refresh schedules and RLS stay in Power BI. Clients log in to a branded portal and see only their own data, without a Pro licence each. And if you like how fast AI builds dashboards, you can have an AI app like Claude build a fully custom dashboard on your semantic model, with each viewer's row-level security applied. We compared the options in Creating Power BI dashboards with AI.
So the short version: explore with Claude, govern with BI, and share with clients through a portal.
Frequently asked questions
Can Claude Dashboards replace Power BI?
Not for most teams. Anthropic positions Claude Dashboards for quick, exploratory questions that work alongside BI tools. Power BI still covers governed measures, row-level security, version control and large audiences.
Does Claude Dashboards work with Power BI?
Not out of the box. As of October 2026 there's no ready-made Microsoft connector for Claude. Microsoft's Power BI MCP server can be added as a custom connector, but it needs an Entra app registration and admin setup.
Is Claude Dashboards safe for sensitive data?
It depends on your setup. Live queries run with each viewer's own permissions, but data extracts in a dashboard can be read by anyone who can open it. Artifacts are also not available in organizations with zero data retention enabled.
Which plans include Claude Dashboards?
Claude Dashboards is in beta on Pro, Max, Team and Enterprise plans. On Enterprise it's off by default until an owner turns it on.
Can I share a Claude dashboard with external clients?
Only if your admin allows sharing outside the organization, and the dashboard isn't a white-label client portal. For branded, per-client reporting on Power BI, a portal like DataTako is the better fit.

