
Short answer: yes, AI can build dashboards on your Power BI data in 2026, and there are three ways to do it. You can build reports yourself in Power BI Desktop, let Copilot in Power BI generate report pages, or let an AI app like Claude or ChatGPT build a complete custom dashboard on your semantic model. All three use the same data. They differ in design freedom, cost and who can view the result.
Most teams we talk to aren't looking to throw Power BI away. Their data model is solid, the numbers are trusted, and the refresh schedule runs every night. What they're tired of is the part after that: dragging visuals onto a canvas, fiddling with formatting, and waiting days for someone to build "just one more page". That's usually what people mean when they search for a Power BI alternative.
So this article compares the three ways to build a dashboard on top of a Power BI semantic model, honestly, including where each one falls short.
TL;DR
- Power BI Desktop gives you full control, but you build every visual by hand. Viewers need a Power BI Pro license unless the content sits on an F64 capacity or larger, or is embedded.
- Copilot in Power BI creates report pages from a prompt. It needs a paid Fabric capacity of F2 or higher, works with the standard visuals, and can't change styling or use custom visuals.
- An AI-built data dashboard is written from scratch by an AI app: layout, charts, filters, drill-down, tabs. In DataTako it runs on your semantic model with each viewer's row-level security, and viewers don't need a Pro license.
- None of these replace your data model. The semantic model stays in Power BI either way. What changes is how the dashboard on top of it gets built and shared.
Option 1: build the report yourself in Power BI Desktop
This is how most Power BI reports are made today. You open Power BI Desktop, connect to your semantic model, and build the report page by page: pick a visual, drag fields onto it, set the formatting, add slicers, sync them across pages, set up bookmarks or drill-through, and publish.
What it's good at:
- Complete control over every visual and every pixel.
- Rich built-in features such as drill-through, bookmarks, field parameters and export to Excel.
- Anyone with Power BI skills can open the report later and change it.
Where it gets slow:
- Every visual is manual work. A polished dashboard with ten visuals and a few interactions easily takes a day, and changes go back into the same queue.
- Design is limited to what the visuals and formatting pane allow. Custom layouts often mean custom visuals or workarounds.
- Sharing it inside Microsoft's licensing model means a Pro license per viewer ($14 per user per month since April 2025), unless the workspace runs on an F64 capacity or larger. Our Power BI licensing guide goes into the details.
Option 2: let Copilot in Power BI create report pages
Microsoft's own AI option. In the Copilot pane you describe the report you want, or click "Suggest content for this report", and Copilot generates a report page. You can then ask it to add, change or delete visuals.
What it's good at:
- It's built into Power BI, so the result is a normal Power BI report that your team can keep editing in the usual way.
- It's quick for a first draft of a standard report page.
Where it's limited, according to Microsoft's own documentation:
- It needs a paid Fabric capacity of F2 or higher, or Power BI Premium P1 or higher. A Pro or Premium Per User license alone isn't enough, and trial capacities don't count.
- It doesn't support custom visuals, and it can't make styling or formatting changes.
- It can't create pages for semantic models with a live connection to Analysis Services, real-time streaming models, or models where implicit measures are turned off.
In other words, Copilot speeds up the same report-building process. The result still looks and behaves like a standard Power BI report page. If you want to know what Copilot costs in practice, we broke that down in Does Power BI Copilot need F64?
Option 3: let an AI app build a data dashboard on your semantic model
This is the newest option, and it works differently. Instead of an AI placing visuals on a Power BI canvas, an AI app such as Claude or ChatGPT writes the entire dashboard itself. It looks at the tables and measures in your semantic model, writes the queries, and builds the page around them.
In DataTako, this is called a data dashboard. It works like this:
- You create the dashboard in DataTako. You choose the semantic model, the report group it appears in, and who gets access.
- You ask your AI app to build it. DataTako gives you a ready-made prompt. You add what you want to see, in plain language.
- The AI app builds a draft. It connects to DataTako through the AI connector (MCP), reads the model, tests its queries, and saves everything as a draft you can preview.
- You check it and publish. Ask for changes in the same chat until you're happy, then publish. Users open it in DataTako like any other report.
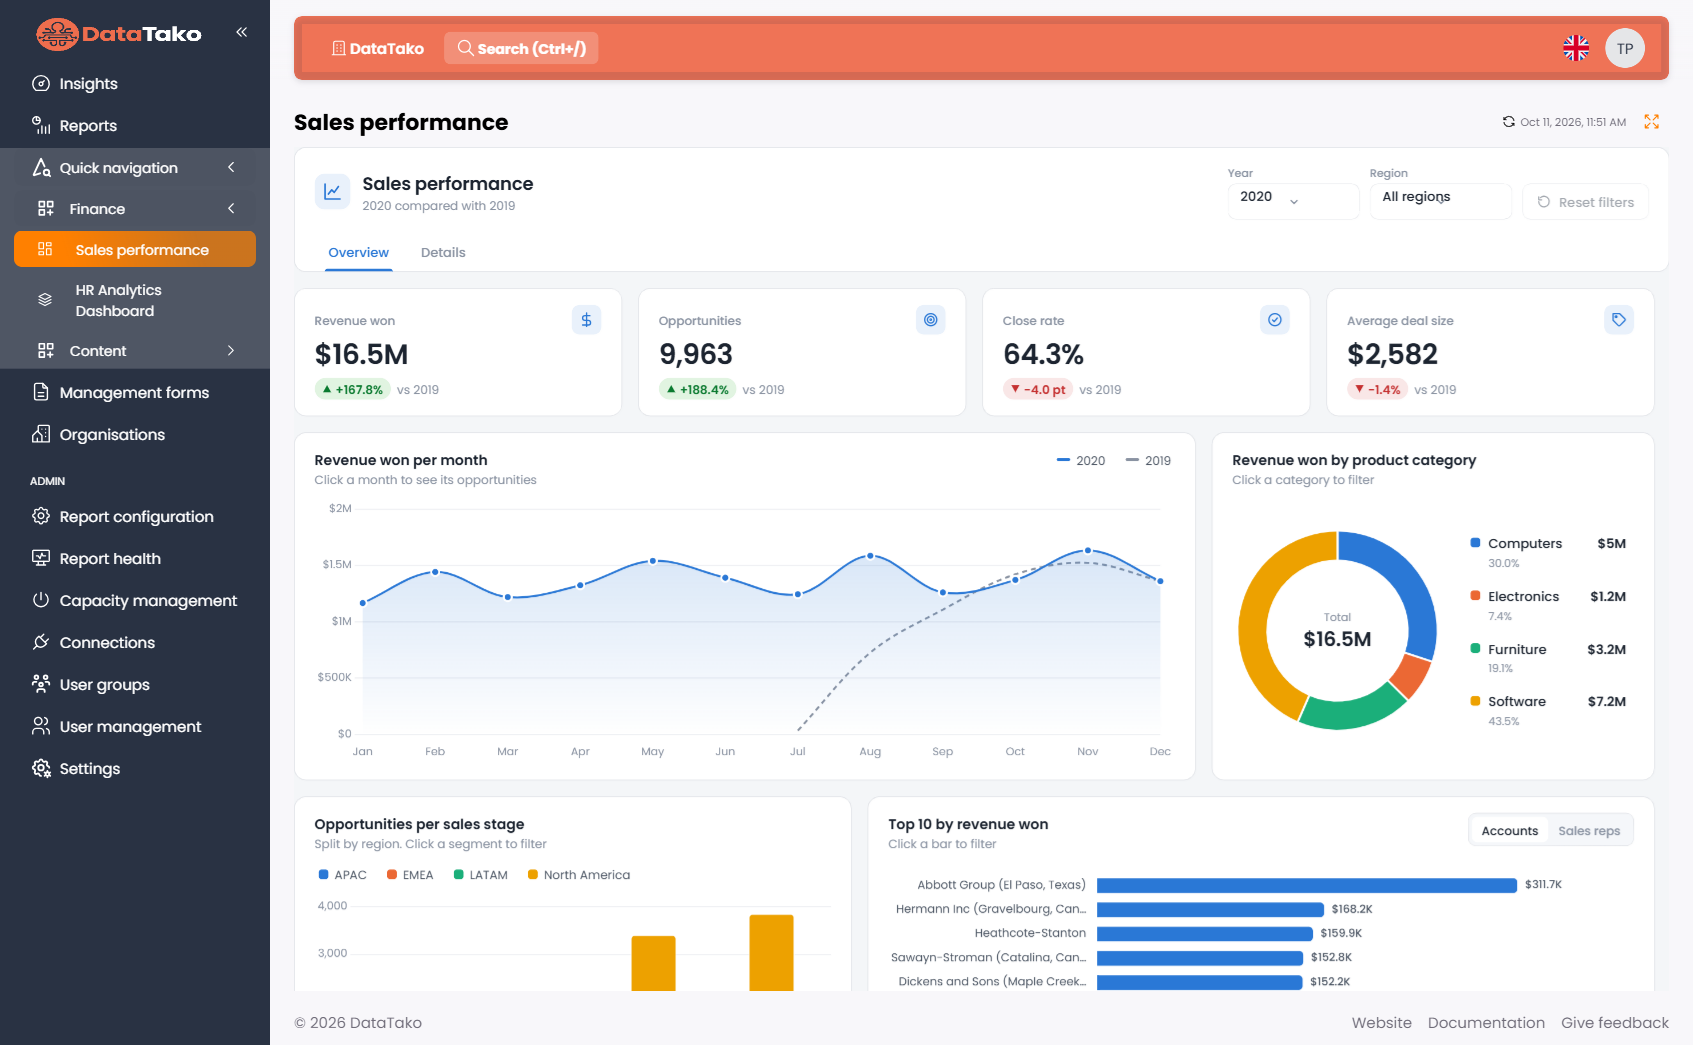
Because the AI writes the dashboard instead of configuring visuals, you're not limited to what a visual supports. Some things teams ask for:
- KPI tiles with a comparison to last year, colour-coded up or down.
- Clickable charts that filter the rest of the dashboard, with a "reset filters" button.
- Drill-down from year to month to individual transactions, with a breadcrumb back.
- Multiple pages or tabs in one dashboard, for example an overview and a details page.
- Detail panels that open when you click a customer or product.
- Your own colours and fonts, labels in the user's language, and numbers and dates formatted the way they're used to.

Security works the same as your reports. Every query runs in Power BI with the row-level security roles of the person viewing the dashboard. Two people can open the same dashboard and see different numbers, exactly as with a report. If row-level security is new to you, our guide on implementing RLS in Power BI explains how roles work.
Side by side
Three ways to build a dashboard on a Power BI semantic model (2026)
| Power BI Desktop | Copilot in Power BI | AI-built data dashboard (DataTako) | |
|---|---|---|---|
| Who builds it | You, visual by visual | Copilot, on a Power BI report page | An AI app such as Claude or ChatGPT |
| How you ask for changes | Edit it yourself | Prompt or edit in Power BI | Ask the AI app in plain language |
| Design freedom | Within visuals and formatting options | Standard visuals, no styling changes | Fully custom layout, charts and interactions |
| Interactivity | Slicers, drill-through, bookmarks | Same as Power BI reports | Clickable filters, drill-down, tabs, panels, as the AI builds them |
| Data source | Your semantic model | Your semantic model | Your semantic model |
| Row-level security | Yes | Yes | Yes, static roles per viewer |
| What viewers need | Pro license, or content on F64+ / embedded | Pro license, or content on F64+ / embedded | A DataTako login, no Pro license |
| Capacity needed | None for Pro sharing | Paid Fabric F2+ or Premium P1+ | Fabric or Power BI Embedded F2+ for DataTako |
| Best for | Complex, long-lived reports maintained by BI specialists | Quick first drafts of standard report pages | Custom, polished dashboards built fast, shared with people without Pro licenses |
When Power BI Desktop is still the better choice
AI-built dashboards aren't the answer to everything, and we'd rather tell you that up front.
- Your team wants to edit the report themselves. A Power BI report can be changed by anyone with Power BI skills. A data dashboard is changed by asking the AI app, which suits most people but not every BI team.
- You need very large detail tables. A query in a data dashboard returns at most 10,000 rows. That's plenty for charts and summaries, but not for exporting a full transaction list.
- Your model uses dynamic row-level security. Roles that filter on the signed-in user, for example with USERPRINCIPALNAME, aren't supported in data dashboards yet. Static roles are.
- You rely on Power BI-specific features such as paginated reports, bookmarks or export to Excel. Those stay in Power BI reports, which DataTako can share alongside your data dashboards.
When an AI-built dashboard is the better choice
- You want something that doesn't look like every other Power BI report. Custom layouts, your house style and interactions that a standard visual doesn't offer.
- You need it this week, not next month. Describing a dashboard takes minutes. Changes are a message in a chat, not a ticket in a queue.
- The audience is a client, a manager or a team without Power BI licenses. They log in to DataTako and see their own data, without a Pro license each.
- You already trust your semantic model. The AI builds on the measures and relationships you have, so the numbers match your Power BI reports.
Is DataTako a Power BI alternative?
Not for your data model, and that's on purpose. DataTako runs on top of Power BI: your semantic models, refresh schedules and row-level security stay exactly where they are. What DataTako replaces is the part that frustrates most teams. That's building every visual by hand, and paying a Pro license for every viewer.
If you're searching for a Power BI alternative because of DAX, the data model or Microsoft itself, a different BI tool may be the better fit. If you're searching because building and sharing dashboards is too slow or too expensive, keeping Power BI and changing how dashboards are built is usually the cheaper and faster route.
How to build your first AI dashboard in DataTako
- Turn on AI connectors and Data dashboards under Settings > Features.
- Go to Report configuration and choose Data dashboard (built with AI). Pick the semantic model and who gets access, and click Create and continue.
- Connect your AI app (Claude, ChatGPT or another app that supports MCP connectors) and paste the example prompt from the configuration page. Add what you want to see.
- Check the draft preview, ask for changes, and publish.

The full walkthrough, including row-level security and data refresh options, is in the data dashboards documentation. You can try it during the 30-day free trial, no payment details needed.
Frequently asked questions
Can ChatGPT or Claude create Power BI dashboards?
Yes, if they're connected to your Power BI data. Through an MCP connector, an AI app can read your semantic model and run queries on it. Microsoft offers MCP servers for querying and editing models, which we explain in Power BI MCP servers explained. With DataTako, the AI app can also build a complete dashboard on the model and save it for your users, with their row-level security applied.
Does Copilot in Power BI need a Fabric capacity?
Yes. According to Microsoft's Copilot documentation, Copilot needs a paid Fabric capacity of F2 or higher, or Power BI Premium P1 or higher. A Power BI Pro or Premium Per User license alone isn't enough.
Do AI-built dashboards respect row-level security?
In DataTako they do. Every query runs in Power BI with the static row-level security roles of the person viewing the dashboard. A user without a role on a model with row-level security doesn't get to see the numbers.
Do viewers need a Power BI Pro license?
Not for dashboards in DataTako. Viewers log in to DataTako and see the dashboards they've been given access to. DataTako itself runs on a Fabric or Power BI Embedded capacity of F2 or higher.
Does the AI app see my data?
While building, it does see some of it. The AI app reads the structure of the model and runs test queries, so it sees data that the person building the dashboard has access to. When people open the published dashboard, their queries go from DataTako to Power BI directly. The AI app isn't involved at that point.
Can I still change the dashboard later?
Yes. Ask the AI app for changes in a new chat, check the draft and publish again. Users keep seeing the published version until you do.
What's the best Power BI alternative for building dashboards with AI?
It depends on what you want to keep. If you want to stay in Power BI reports, Copilot in Power BI is the natural choice. If you want custom dashboards on your existing Power BI data, shared with people who don't have Pro licenses, an AI-built data dashboard in DataTako is the faster route. If you want to leave Power BI completely, look at a different BI tool altogether.

