
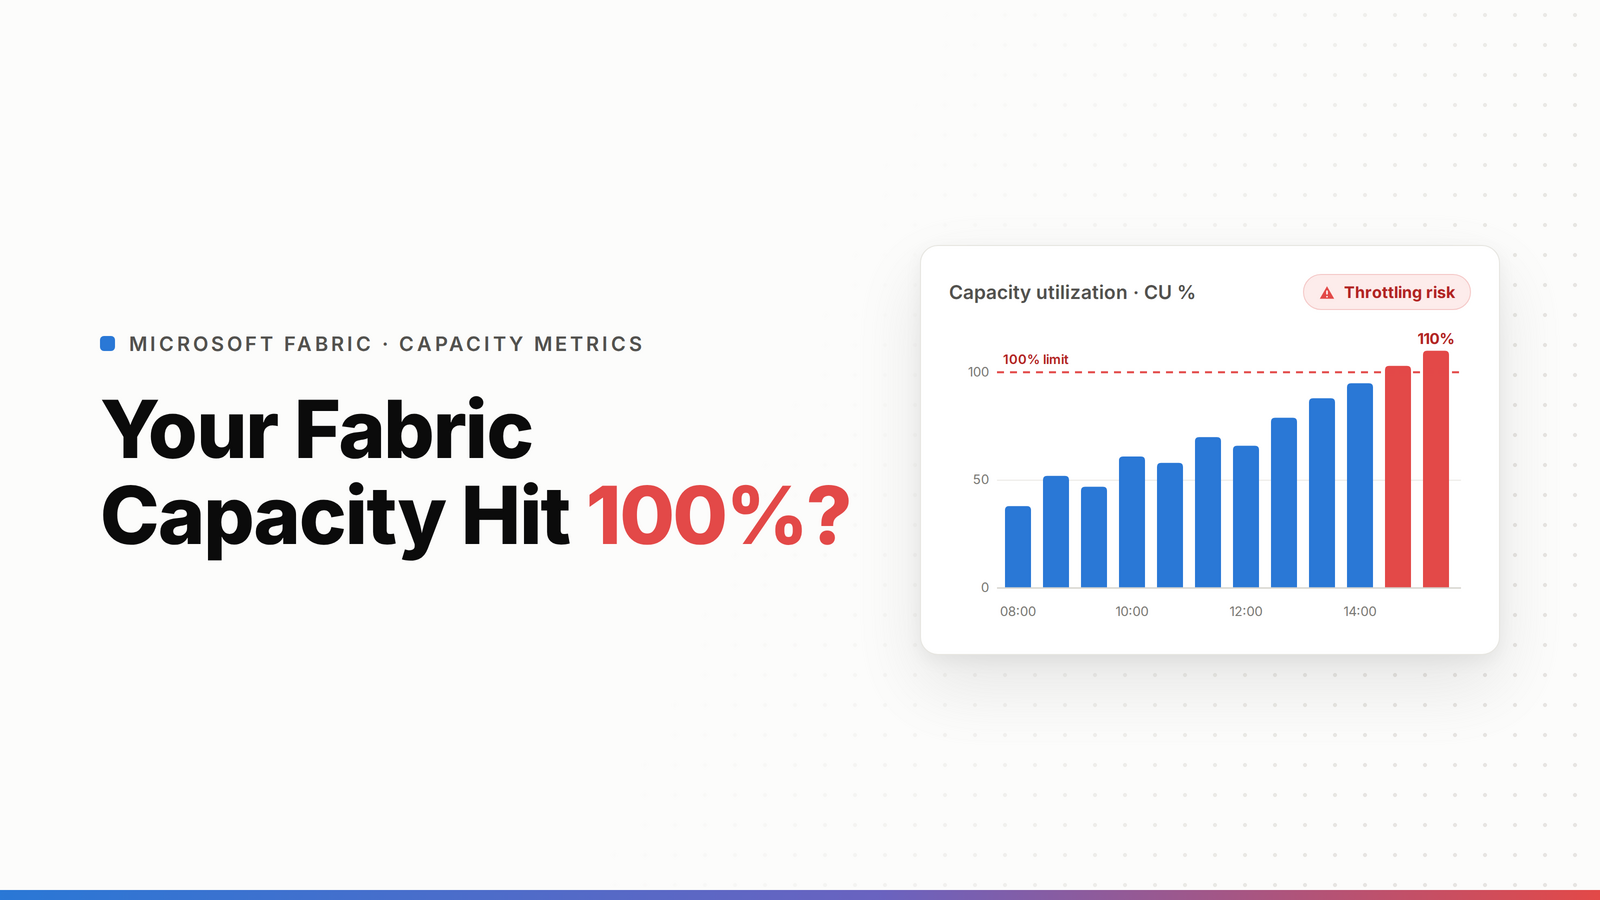
Hitting 100% on your Fabric capacity isn't the problem by itself. Short spikes to or above 100% are normal, that's what bursting is for. The real problem is throttling, which starts when your smoothed spend stays over your capacity's CU budget long enough. The Fabric Capacity Metrics App shows you which one you've got. Once you know, most fixes aren't "buy a bigger SKU": find the few items burning the most CUs, reschedule heavy refreshes off-peak, and cut concurrency. Scale up only when the metrics genuinely say so.
Your capacity is at 100%, reports are slow, and the instinct is to panic-buy a bigger SKU. Don't. Half the time the capacity is fine and doing exactly what it's designed to do. The other half, you're throttled, and a bigger SKU is only one of several fixes, often not the cheapest. The Metrics App tells you which situation you're in. Here's how to read it.
TL;DR
- 100% is not throttling. Brief spikes are normal (bursting and smoothing handle them).
- Throttling starts when your smoothed overspend piles up. It escalates: interactive delay, then interactive rejection, then background rejection.
- The Metrics App shows utilisation, throttling, and which items burn the most CUs.
- Most fixes aren't a bigger SKU: optimise the top consumers, move heavy refreshes off-peak, reduce concurrency.
- Scale up only when you're throttled at genuine sustained peak, not on a one-off spike.
100% vs throttling: what's actually wrong
This is the whole confusion. A Fabric capacity can spend above its CU budget for short bursts, because bursting lets a job borrow future capacity to finish faster, and smoothing spreads that spend out. So seeing 100%, or even a spike over it, doesn't mean anything's broken.
Throttling is what actually hurts. When your smoothed spend stays over budget, Fabric starts protecting the capacity in stages, based on how much future capacity you've already borrowed:
- Interactive delay first: interactive operations get held back a bit.
- Interactive rejection next: interactive operations start failing.
- Background rejection last: even refreshes and pipelines get rejected.
So "slow for a second" is fine. "Everything's delayed" or "operations are getting rejected" is throttling, and that's what you fix.
How to read the Metrics App
The Fabric Capacity Metrics App is where the answer lives. You're looking for three things:
- Utilisation over time: are you brushing your CU budget occasionally, or sitting over it for long stretches? Occasional is fine. Sustained is the problem.
- Throttling: the app shows whether and when throttling kicked in, and which stage. If this is empty, you're not throttled, and slowness has another cause.
- Top items by CU: almost always a handful of reports, refreshes, or pipelines are doing most of the damage. This is the list that tells you what to fix.
If reading it makes your eyes glaze over, that's why we built the Fabric Metrics Decoder: it translates what the app is showing into what to actually do.
Common causes of overload
Sustained overload usually comes from a small number of culprits:
- A few heavy reports with expensive visuals or bad DAX, hammered by concurrent users.
- Big refreshes running during business hours and colliding with interactive use.
- Too much concurrency for the SKU at peak.
- Background jobs (pipelines, notebooks) stacked on top of everything else.
Notice what's not on that list: "the SKU is just too small" is possible, but it's the last thing to assume, not the first.
Fixes that aren't "buy a bigger SKU"
Work these before you spend more:
- Find and fix the top CU consumers. The Metrics App names them. Optimise the worst report or refresh and you often reclaim more headroom than a SKU step would give you.
- Move heavy refreshes off-peak. Background operations smooth over 24 hours, so scheduling big refreshes for the middle of the night keeps them out of your users' way.
- Cut concurrency where you can. Stagger refreshes, reduce auto-refresh frequency, and check for runaway scheduled jobs.
- Right-size, don't just scale up. If you're genuinely throttled at real peak after the above, then step up a SKU. And check you're not overpaying the rest of the time, see how to cut your Fabric bill.
When you genuinely need more capacity
Sometimes the answer really is a bigger SKU. You need one when, after optimising the top consumers and moving refreshes off-peak, you're still throttled at your true sustained peak, not just on a rare spike. That's a capacity that's honestly too small for its workload. Step it up one tier, then watch the metrics again. (For sizing, see which Fabric capacity do I need?)
Frequently asked questions
Does hitting 100% on a Fabric capacity mean it's overloaded?
No. Short spikes to or above 100% are normal because bursting lets operations borrow future capacity and smoothing spreads the spend over time. Overload only becomes a real problem when your smoothed spend stays over your CU budget long enough to trigger throttling. Brief peaks are expected.
What is Fabric capacity throttling?
Throttling is how Fabric protects a capacity that's overspending its CU budget. It escalates in stages based on how much future capacity you've borrowed: first interactive operations are delayed, then interactive operations are rejected, and finally background operations like refreshes are rejected too. It's the actual cause behind "reports suddenly got slow or started failing".
How do I fix a throttled Fabric capacity?
Start in the Fabric Capacity Metrics App and find the top CU-consuming items. Optimise the worst reports or refreshes, move heavy refreshes off-peak so they don't collide with interactive use, and reduce concurrency. Only step up to a bigger SKU if you're still throttled at genuine sustained peak after that.
What does the Fabric Capacity Metrics App show?
It shows your capacity's CU utilisation over time, whether and when throttling occurred, and which items (reports, refreshes, pipelines) consumed the most CUs. That top-consumers list is usually where the fix is, because a handful of items typically cause most of the overload.
Should I buy a bigger SKU when my capacity is at 100%?
Usually not as the first move. Most overload comes from a few heavy items and business-hours refreshes, which you can fix without spending more. Buy a bigger SKU only when you're still throttled at real sustained peak after optimising the top consumers and rescheduling refreshes.
Why are my Power BI reports slow if I'm not throttled?
If the Metrics App shows no throttling, the slowness is coming from something else: an inefficient report or model, a slow data source, or a heavy refresh running at the same time. Throttling and report design are different problems, and the Metrics App tells you which one you're dealing with.

