

10 essential Power BI financial dashboards
Use these as a blueprint — most finance teams build some subset of these, and mature teams build all ten.
1. CFO executive dashboard
The single-page view the CFO opens daily. Revenue, EBITDA, cash position, working capital, and three to five business-critical KPIs. Everything else is one click away. Designed to be read in 30 seconds.
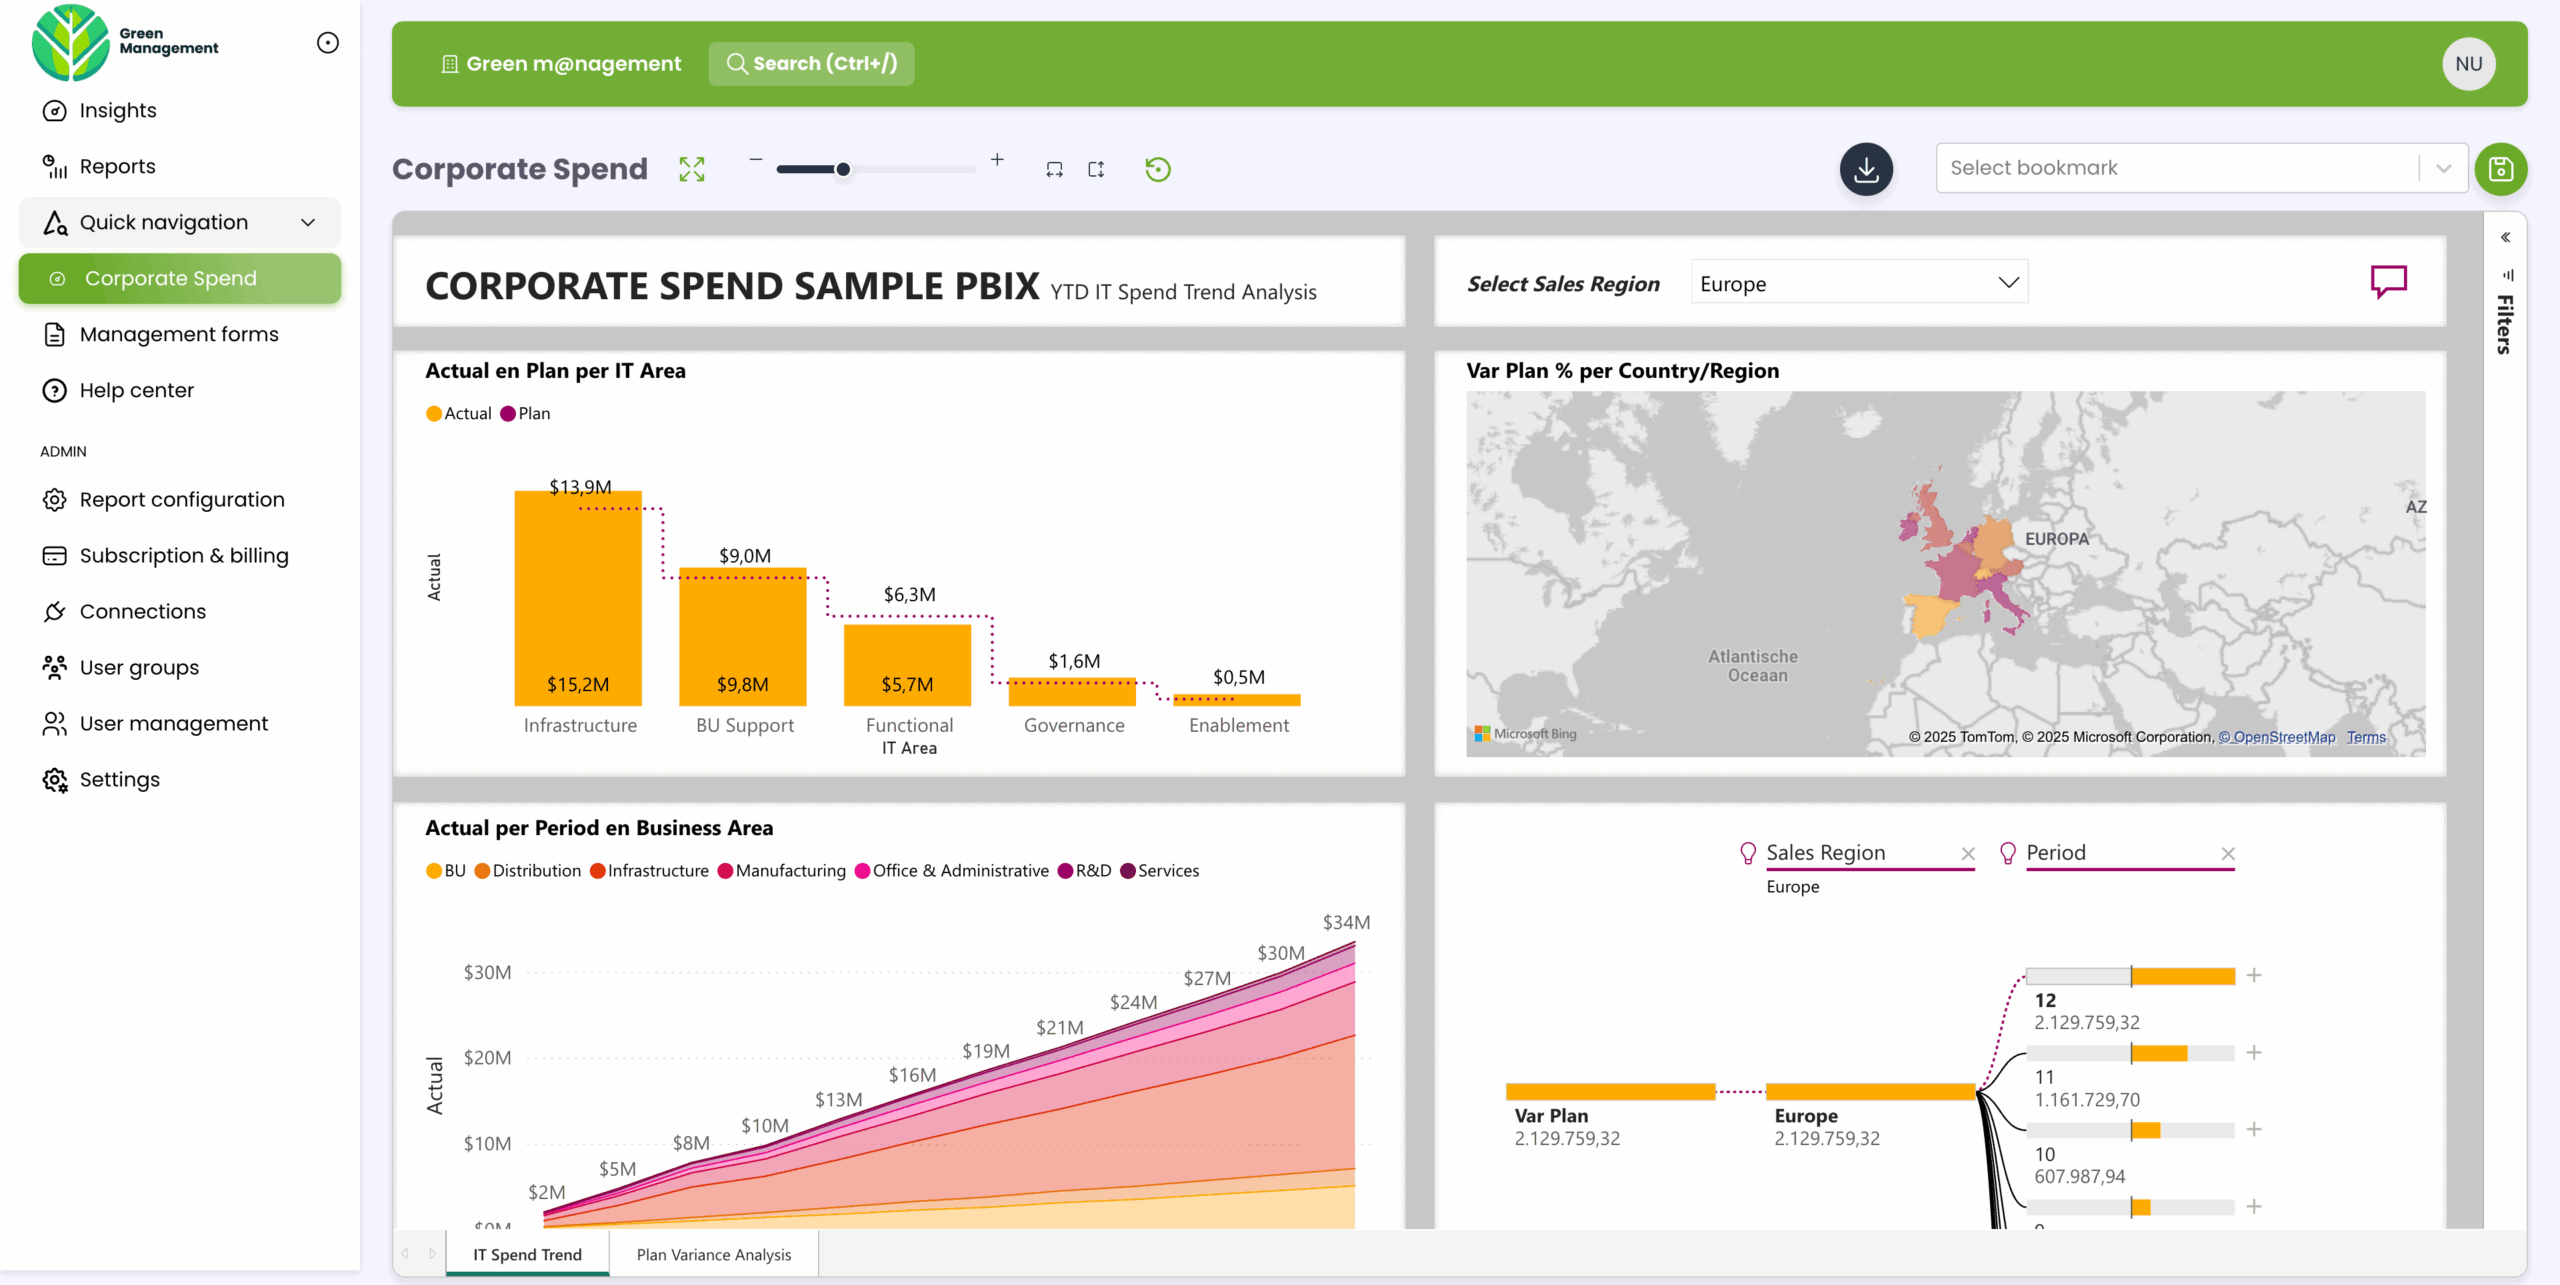
2. P&L (profit & loss) dashboard
Revenue by line, cost of sales, gross margin, operating expenses, EBITDA. Usually with month-on-month and year-on-year comparison columns, plus variance against budget. The workhorse of the FP&A function.
3. Cash flow dashboard
Operating, investing, and financing cash flows. Opening and closing cash balance. Days sales outstanding, days payable outstanding, cash conversion cycle. The dashboard most CFOs wish they'd built sooner.
4. Balance sheet dashboard
Assets, liabilities, equity. Current ratio, quick ratio, debt-to-equity, working capital. Slower-moving than P&L but critical for treasury and lender conversations.
5. Budget vs actuals dashboard
Side-by-side budget and actual numbers across the chart of accounts, with variance amount, variance percentage, and forecast-to-year-end. The dashboard FP&A teams live in during budget season.
6. Accounts receivable (AR) aging dashboard
Outstanding invoices by ageing bucket (0–30, 31–60, 61–90, 90+ days). Top customers by overdue balance. DSO trend. Critical for working capital management and collections.
7. Financial forecasting dashboard
Forecast vs actual at line-item level. Confidence intervals. Driver-based forecasting models. What-if scenarios. The bridge between historical reporting and planning.
8. KPI scorecard
The shortlist of metrics leadership agreed matter, with current value, target, RAG status, and trend. Deliberately sparse — three to ten KPIs maximum. Pairs with the CFO executive dashboard.
9. Treasury and liquidity dashboard
Cash positions across accounts and currencies, debt maturity ladder, available credit, FX exposure. The dashboard treasury teams need but most companies don't build.
10. Audit and compliance dashboard
Exceptions, unusual transactions, control failures, segregation of duties violations. Real-time monitoring of the things audit teams used to catch only after the fact. Critical in regulated industries — see the financial services playbook and the cybersecurity playbook for related compliance dashboards.
How to build a financial dashboard in Power BI
Seven steps from raw GL data to a published dashboard:
- Define the audience and the question. A CFO dashboard and an FP&A working dashboard are different artefacts. Don't build one and try to use it for both.
- Build the data model first. Star schema with a fact table for transactions and dimension tables for date, account, entity, currency, and (for multi-tenant scenarios) client. Avoid the temptation to do everything in DAX without a proper model.
- Build the date dimension carefully. Fiscal year, fiscal quarter, calendar versus fiscal flags, period-locked flag. This single table makes or breaks every time-intelligence calculation you'll ever build.
- Write the core DAX measures. Revenue, gross margin, EBITDA, year-over-year variance, last-twelve-months, year-to-date. Build them once, reuse them across every dashboard.
- Configure Row-Level Security. Even for internal dashboards — entity-level RLS prevents the "wrong country saw the wrong data" mistake before it happens. See the RLS guide.
- Design the visuals for the question. Cards for the headline numbers, line charts for trends, waterfall for variance, tables for the detail. Resist the urge to make it pretty before it's right.
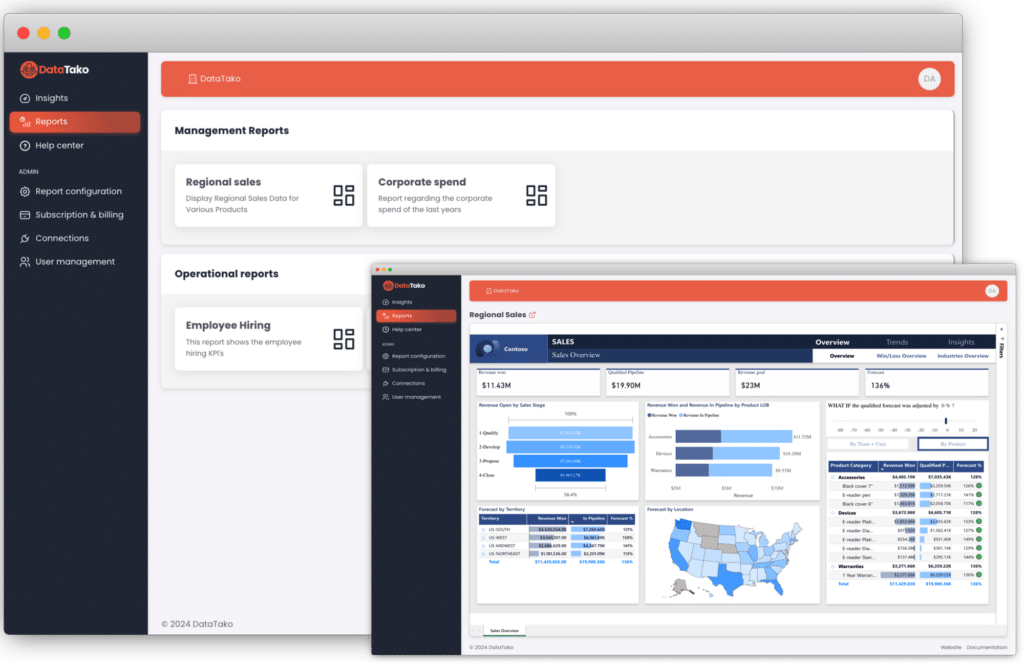
- Publish and choose a delivery method. Internal Power BI App for the finance team, embedded portal via DataTako for clients and external stakeholders. The delivery method is part of the dashboard design, not an afterthought.
For deeper guidance on Import vs DirectQuery (which affects how fresh your financial data can be), see Import vs DirectQuery.
Best practices for financial dashboards
- One question per dashboard. Resist the urge to combine P&L, balance sheet, and cash flow into one mega-dashboard. Each answers a different question; each deserves its own view.
- Lead with the headline number. The first thing the eye should land on is the metric the audience cares most about — usually a single big card for revenue or EBITDA.
- Always show variance. A number on its own is meaningless. Variance against budget, prior period, or year-ago is what tells you whether the number is good or bad.
- Use a fiscal calendar. Power BI's default time intelligence assumes calendar years. Set up a proper fiscal date dimension before you do anything else.
- Lock the colour palette. Green isn't always good in finance — declining costs are green, declining revenue isn't. Pick colours deliberately, then stick to them across every financial dashboard.
- Configure RLS even for internal dashboards. Entity-level, region-level, or department-level RLS prevents the "wrong country saw the wrong data" mistake before it happens.
- Don't overcrowd. A dashboard with twenty visuals is not informative; it's noise. Five to seven well-chosen visuals, with the detail one click away in a report, is the right shape.
- Test against locked periods. When the source data restates a closed month, your dashboard should not. Build period locking into the model from day one.
- Plan the sharing model up front. Internal finance team via Power BI App is one delivery; external clients via DataTako is another. The data model often needs to be different — particularly the RLS configuration.
Sharing financial dashboards: the compliance challenge
Financial dashboards have sharing requirements that other dashboards don't:
Audit logging is mandatory in regulated environments. Financial services regulators (FCA, AFM, BaFin) and accountancy standards (SOX, PCAOB) require an audit trail of who accessed which client's data. Power BI's native audit log is at the tenant level and gives shallow detail. DataTako provides per-viewer, per-report audit logs with the granularity compliance teams need.
Row-Level Security must be airtight. For accounting firms with multiple clients, or asset managers with multiple investors, each viewer must see only their data. RLS misconfiguration is one of the most expensive mistakes in financial dashboard delivery — the cost is regulatory, not just operational. See the RLS implementation guide.
External users need branded, professional delivery. An accountancy firm sending clients to powerbi.com to view their reports undermines the professional positioning. White-label delivery — your firm's domain, logo, and colours — is table stakes. Native Power BI offers none of this; tools like DataTako handle it by default.
Per-viewer licensing breaks the business model. A finance advisor with 200 clients can't justify $14 per month per client just to give them dashboard access. Fabric capacity plus DataTako removes that cost entirely. See Power BI licensing and share Power BI reports for the full breakdown.
Period locking and data integrity matter more here. When a client looks at their Q3 numbers in Q4, those numbers should be what was reported at Q3 close — not the restated version after some adjustment. The delivery layer needs to respect that.
We compare all of the external sharing options in 4 ways to share Power BI reports with external users, and the licensing implications in the hidden cost of Power BI Pro for BI agencies — which applies just as strongly to accountancy and advisory firms.
Where DataTako fits
DataTako is built specifically for the secure, branded delivery of Power BI content to external audiences — which is exactly the gap finance teams hit when they try to share dashboards with clients, board members, or investors.
- No per-viewer Pro licences — share with unlimited clients and stakeholders on one Fabric capacity. An accountancy firm with 500 clients pays the same as one with 50.
- Audit logs at viewer level — every report view logged with user, timestamp, IP, and content accessed. The granularity regulators and auditors actually want.
- Row-Level Security wired to your client identities — each client sees only their own data, scoped by your application's identity rather than by Entra group memberships.
- White-label by default — your firm's domain, logo, and colours. Different branding per client if you serve multiple end-clients under different brands.
- Smart capacity management — automated pause and resume of your Fabric capacity, cutting compute costs by up to 70 percent. Critical when client reports are read during business hours only.
A typical accountancy firm setup: one Fabric F2 capacity (~€263/month), one DataTako licence covering 100 clients (~€200/month), a handful of Pro licences for the firm's analysts (~€70/month). Total around €530/month for unlimited client access — versus around €1,400/month on Pro alone, before any of the branding, audit log, or RLS work. See the cost breakdown on the optimise Power BI licence costs page and the financial services playbook for the full deployment pattern.
Teams that would have spent months building Power BI Embedded into their client portal are sharing branded financial dashboards within ten minutes of signing up. See how DataTako works or read the MeerMetData case study.
DataTako doesn't replace Power BI — your financial model, measures, and reports stay in Microsoft's ecosystem. We're the delivery and security layer for everyone outside your finance team.
Frequently asked questions
What is a Power BI financial dashboard? A single-page Power BI view that surfaces a finance team's most important numbers in real time — revenue, costs, cash position, key ratios, variance against budget. It's built from one or more underlying reports and refreshes as the data does.
What KPIs should a financial dashboard include? It depends on the dashboard. A CFO executive dashboard typically includes revenue, EBITDA, cash position, and three to five business-critical KPIs. A P&L dashboard focuses on revenue, margins, and operating expenses. A balance sheet dashboard focuses on assets, liabilities, and key ratios (current, quick, debt-to-equity). The mistake is trying to fit everything into one dashboard.
How do I share financial dashboards with clients securely? Not easily through native Power BI. The options are guest accounts (which scale poorly and offer no branding), custom Power BI Embedded (four to six months of engineering work), or a white-label portal like DataTako that handles authentication, RLS, audit logs, and branding out of the box.
Does Power BI support multi-currency reporting? Yes — but you have to build it into the data model. You need an exchange rates dimension, DAX measures that apply the right rate to each transaction, and a way to switch between local and group currency views. It's not automatic.
How do I implement Row-Level Security for client-level access? Add a client dimension to your data model, create a USERPRINCIPALNAME-based RLS rule that filters transactions to the viewer's client, and test thoroughly with the "View as" feature. For embedded scenarios (external clients without Microsoft accounts), RLS comes through the embed token's effective identity instead. See the RLS implementation guide.
What's the difference between a P&L dashboard and a balance sheet dashboard? A P&L dashboard answers "how profitable were we this period?" with revenue, costs, and margins. A balance sheet dashboard answers "what does the company own and owe right now?" with assets, liabilities, equity, and ratios. Most teams need both, plus a cash flow dashboard and a KPI scorecard.
Can I build a CFO dashboard in Power BI? Yes, and most finance teams do. The key is restraint — a CFO dashboard should be readable in 30 seconds. Three to five headline metrics on the front page, with everything else one click away. Designs that try to include every KPI on one page fail the 30-second test and end up unused.
How do I handle period-end closing in Power BI? Period locking lives in the data model, not the dashboard. Once a month is closed, the source data for that period should not change. If it does (a late adjusting entry, for instance), you need a clear policy on whether to restate or to book the correction in the current period. Dashboards should respect that policy automatically.
Can I share financial dashboards with my board without giving each member a Power BI licence? Yes — that's exactly what DataTako enables. Board members consume their reporting through a branded portal at your domain, with no Microsoft account required. Try a free trial →
What ERP and accounting systems does Power BI connect to? Most of them, either natively or via connectors. SAP, Oracle, NetSuite, Microsoft Dynamics, Exact, AFAS, Twinfield, Xero, QuickBooks, Sage, and many more. For older or niche systems, you typically route the data through a warehouse first.