
The honest limitations of embedded analytics
No path is perfect. Where embedded analytics gets hard:
Build complexity. Custom embedded analytics — embedding Power BI, Tableau, or anything else into your product — requires significant engineering work. Authentication, multi-tenancy, RLS, branding, and ongoing maintenance can easily consume four to six months of a small team.
Licensing surprises. Per-viewer pricing models look cheap until your customer base grows. A SaaS product with 500 customer organisations can't run on per-seat embedded BI licensing without margin compression. Pick capacity-based or seat-free models for scale.
Multi-tenant security risk. Misconfigured Row-Level Security has leaked customer data at high-profile SaaS companies. The risk increases with the number of tenants. Getting RLS right is technical work that requires careful testing.
Operational maintenance. Embed tokens expire, APIs update, capacity needs monitoring, customers request features. Embedded analytics is a perpetual project, not a one-time integration.
Vendor lock-in. Choosing Power BI Embedded ties you to Microsoft; choosing Tableau ties you to Salesforce; choosing Looker ties you to Google. Custom-built dashboards avoid vendor lock-in but pay for it in engineering cost.
How easy is embedded analytics to implement?
It depends entirely on the path you pick:
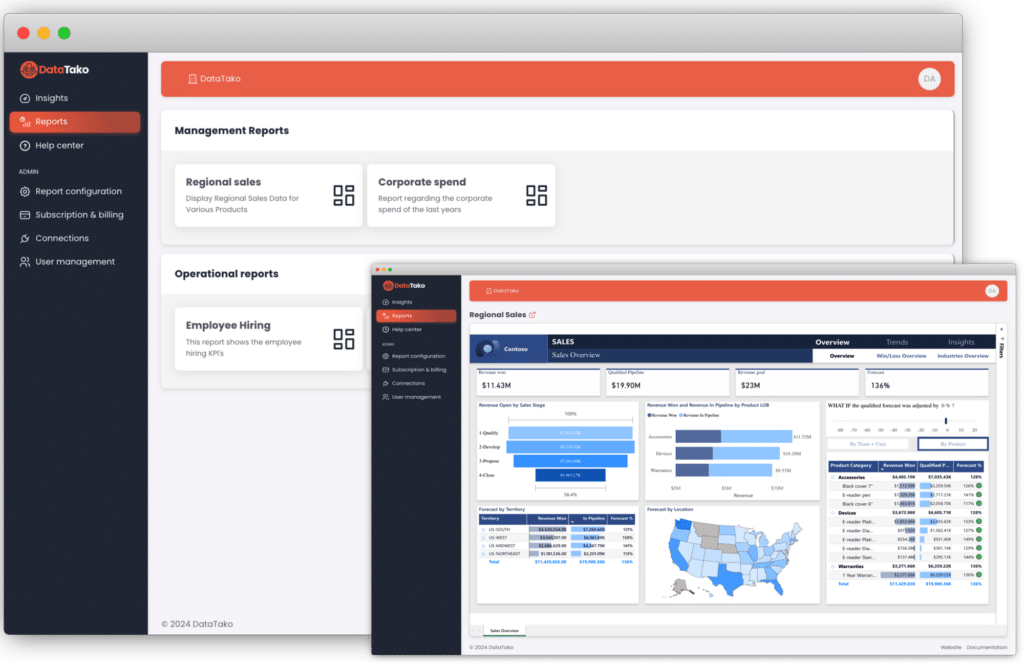
- Platform via DataTako: hours to a working portal. Connect your data, configure branding, invite users. No code required.
- Power BI Embedded built in-house: 4-6 months for a production-ready, multi-tenant, branded portal.
- Tableau Embedded built in-house: 3-6 months for a comparable custom portal.
- Sisense or similar purpose-built embedded platform: 4-12 weeks for a working integration.
- Fully custom React + charting library: 6-12 months for the first production version, with ongoing development indefinitely.
The biggest determinant isn't the platform you pick — it's whether you build the surrounding portal infrastructure yourself or use a platform that handles it. For the build-versus-buy economics specifically, see the build versus buy section below.
How to add embedded analytics to your product: a quick walkthrough
Six steps from "we should add analytics" to "our customers use it daily":
- Define the audience and the questions. Who consumes the dashboards, what decisions do they make, what metrics matter? Skipping this leads to dashboards nobody opens.
- Pick a delivery model. Embedded BI platform (Power BI Embedded, Tableau, etc.) versus purpose-built embedded analytics (Sisense, Cube) versus custom dashboards. This decision determines almost everything downstream.
- Set up multi-tenancy and security. Row-Level Security configured per customer organisation, authentication integrated with your existing identity layer, audit logging for compliance.
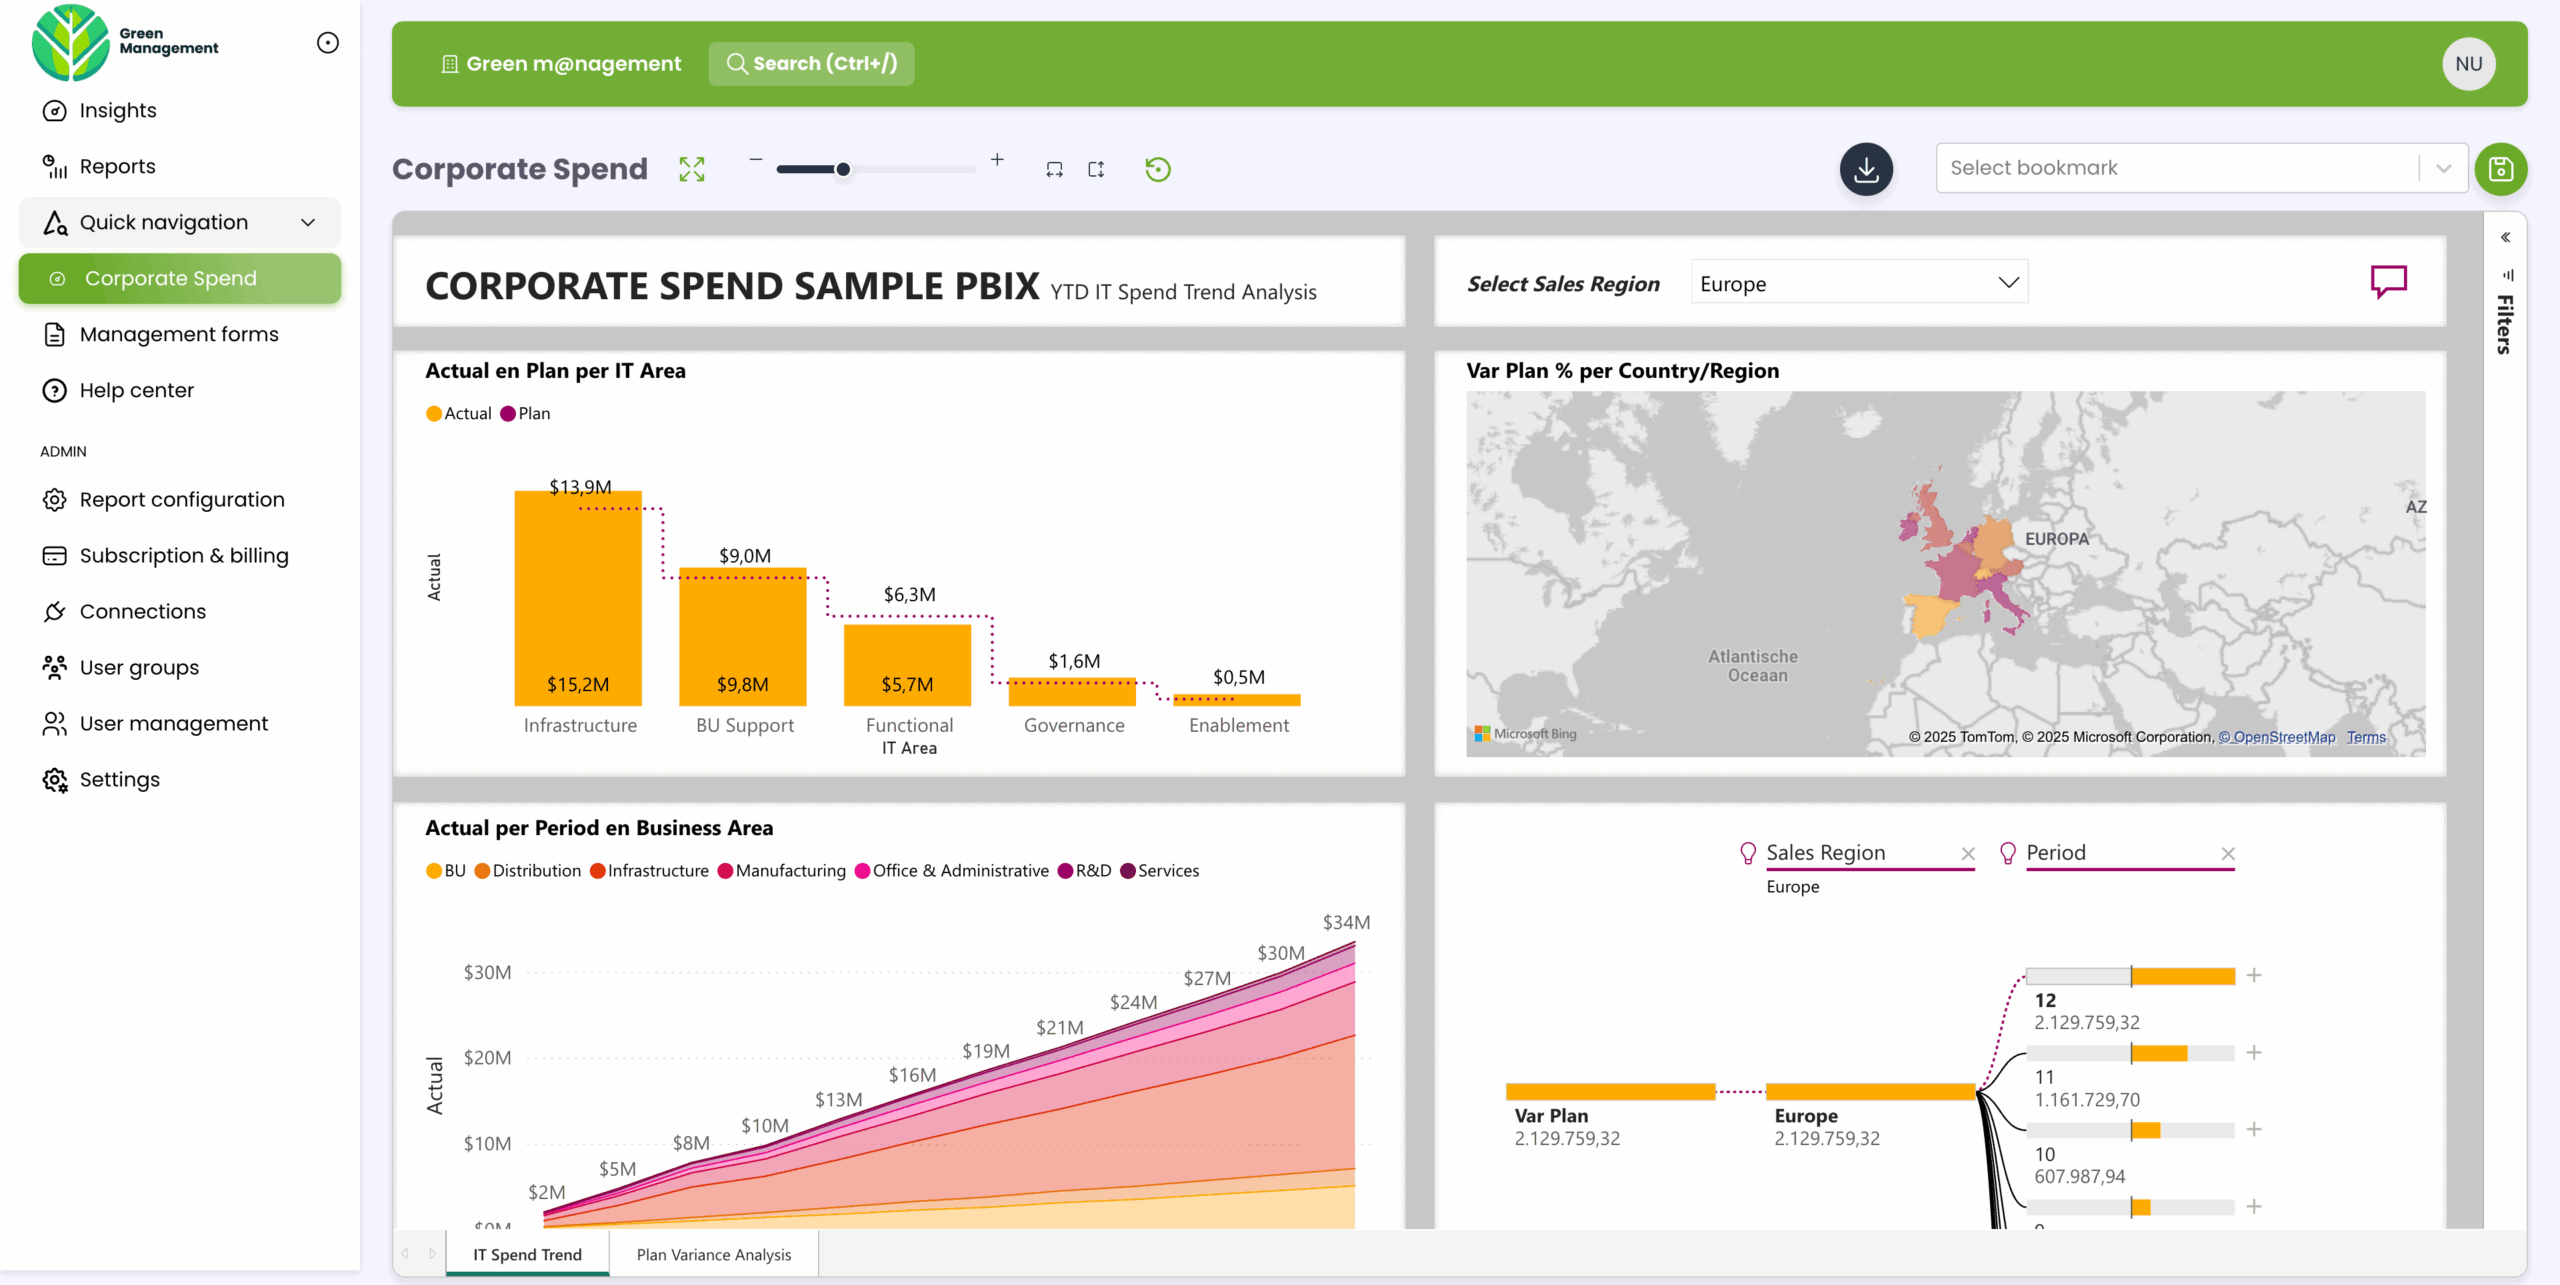
- Design the branded portal. Your domain, your logo, your navigation. End-users should experience analytics as a feature of your product, not a third-party embed.
- Build or buy the embedding layer. This is where months of engineering time disappear if you build it yourself. Platforms like DataTako abstract this entirely.
- Iterate based on usage. What dashboards get used, what metrics get filtered, what reports get exported. The first version is rarely the right one — instrument usage from day one.
For Microsoft-specific implementation guidance, see our complete 2026 Power BI Embedded guide.
Embedded analytics use cases across industries
- SaaS products with analytics as a feature — usage dashboards, ROI reporting, customer-facing KPIs inside the core product
- BI consultancies — multi-tenant client reporting portals where each client sees their own data. Industry playbook →
- Marketing agencies — branded campaign performance dashboards delivered to clients. Industry playbook →
- Financial services — secure client portfolios, regulatory reporting, advisor dashboards. Industry playbook →
- HR & recruitment platforms — workforce analytics and hiring dashboards inside HR products. Industry playbook →
- Cybersecurity & compliance — threat intelligence and audit reporting for security teams. Industry playbook →
- Healthcare platforms — practice analytics, patient outcomes, claims reporting
- B2B marketplaces — seller performance, transaction analytics, marketplace health
- Manufacturing and supply chain — operational dashboards inside ERP and MES products
- Retail and e-commerce platforms — merchant analytics inside e-commerce platforms (Shopify-style)
Build vs buy: the critical decision in embedded analytics
If you remember nothing else from this guide: the build-versus-buy decision is the most important call you'll make in embedded analytics. Get it right and you ship in weeks. Get it wrong and you spend six months engineering infrastructure that doesn't differentiate your product.
Building in-house makes sense when analytics is your core differentiation, you have specific UX requirements no platform can meet, and you have a dedicated frontend team available for 6-12 months minimum. The reward is total control. The cost is opportunity — six months of your best engineers not working on features that move the product forward.
Buying a platform makes sense when analytics is a feature of your product rather than the core differentiation, you want to ship within weeks not months, and you'd rather your team work on the workflows around analytics than on the embedding infrastructure itself. Most SaaS products and B2B platforms fall into this category.
The hybrid path is increasingly common: use a platform for the dashboards and embedding infrastructure (Power BI Embedded via DataTako, for example), but customise the surrounding workflows and integration points yourself. Your team works on what differentiates your product; the platform handles what doesn't.
The cost comparison is rarely close. A custom build typically runs $80,000-$150,000 in engineering time for the first production version, plus 15-25% ongoing annual maintenance. A platform-based approach runs €500-€2,000 per month for unlimited viewers and removes the engineering hiring problem entirely.
For deeper cost analysis, see the hidden cost of Power BI Pro for BI agencies and our licensing optimisation guide.
When you need a delivery layer: where DataTako fits
Even when you pick a strong embedded analytics platform like Power BI Embedded, the work isn't done. The platform gives you the analytics engine and the embedding API, but it doesn't give you:
- A branded client-facing portal where end-users actually log in and consume reports
- Multi-tenant user management scoped to your customer organisations
- Automated capacity management that pauses and resumes to control compute costs
- Group-based access control without administering Microsoft Entra ID
- Audit logging at the viewer level that compliance teams can actually use
That's where DataTako sits. We're built on top of Power BI Embedded and Microsoft Fabric, and we handle everything between the analytics engine and the end-user:
- White-label portal under your domain, your logo, your colours
- Multi-tenant Row-Level Security wired to your customer identities
- Automated Fabric capacity pause and resume cutting compute costs by up to 70%
- User and group management without touching Entra ID
- Audit logs and compliance reporting at the granularity regulators actually want
A typical setup: one Fabric F2 capacity (~€263/month), one DataTako licence covering 100 users (~€200/month), a handful of Pro licences for the creators (~€70/month). Total around €530/month for unlimited external viewers — versus four to six months of engineering work building the same thing yourself.
Teams that would have spent months building Power BI Embedded into their product are sharing branded analytics within ten minutes of signing up. See how MeerMetData streamlined their client reporting or how DataTako works.
DataTako doesn't replace Power BI Embedded — we're the delivery layer on top of it. Your reports, models, and data stay in Microsoft's ecosystem. We handle the portal, the security, the branding, and the operational complexity.
Embedded analytics vs custom-built dashboards
These two approaches solve different problems:
Custom-built dashboards with React, Recharts or D3, and a SQL backend make sense when analytics is your product's core differentiation. You get total UX control, no vendor lock-in, and the ability to optimise for exactly the workflows your users need. The cost is engineering time — typically 6-12 months for the first production version and continuous maintenance forever.
Embedded analytics platforms make sense when analytics is a feature of your product rather than the core differentiation. You get production-quality dashboards in weeks, professional visualisation defaults, and a vendor that handles the analytics engine while you focus on the workflows around it. The cost is platform fees and some loss of UX flexibility.
In practice, the choice tracks the role analytics plays in your product. Data exploration tools, analytics-first products, and BI vendors themselves usually build custom. SaaS products where analytics supports the main workflow — HR platforms, marketing tools, financial software, agency portals — almost always benefit from the embedded route, because their differentiation is the workflow, not the dashboards.
Frequently asked questions about embedded analytics
What is embedded analytics in plain English? Embedded analytics means delivering interactive dashboards and reports inside your own application or portal, under your branding, scoped to your users. Instead of sending people to a separate BI tool, the analytics live inside the product they already use.
What's the difference between embedded analytics and business intelligence? Business intelligence is the broader category — any software that helps people analyse data. Embedded analytics is a specific delivery model within BI where the analytics live inside another application rather than in a standalone tool.
How much does embedded analytics cost? It depends entirely on the path. Custom-built dashboards run $80,000-$150,000 in engineering for the first version. Power BI Embedded plus DataTako runs around €500-€2,000 per month for unlimited viewers. Tableau Embedded and Sisense fall between, with per-user pricing that scales with audience size.
Should I build or buy embedded analytics? Build when analytics is your core differentiation and you have 6-12 months of engineering capacity. Buy when analytics is a feature supporting your main workflow — which is the majority of SaaS and B2B platforms.
What are the top embedded analytics platforms? The main contenders in 2026 are Power BI Embedded (Microsoft), Tableau Embedded (Salesforce), Looker Embedded (Google), Sisense, Qrvey, Cube, and Embeddable. Each has clear positioning by ecosystem fit and use case.
Can I embed Power BI in my SaaS product? Yes, through Power BI Embedded with the app-owns-data pattern. End-users consume reports without their own Microsoft accounts. The technical implementation is significant — typically four to six months — which is why platforms like DataTako abstract it. See our Power BI Embedded guide.
What is white-label embedded analytics? White-label means the analytics render under your branding rather than the underlying platform's. Your domain, your logo, your colours, your navigation — end-users may not realise a third-party tool is rendering the dashboards at all.
Do I need a data warehouse for embedded analytics? It helps but isn't always required. For small data volumes and simple sources, embedded analytics platforms can connect directly to operational databases. For meaningful scale or complex transformations, a data warehouse (Snowflake, BigQuery, Databricks, Azure SQL, Microsoft Fabric) becomes essential.
How long does it take to add embedded analytics to my product? Hours with a managed platform like DataTako. Weeks to months for a self-built integration with Power BI Embedded, Tableau Embedded, or Sisense. Six to twelve months for fully custom dashboards.
Does DataTako replace embedded analytics platforms? No — DataTako sits on top of Power BI Embedded. We're the delivery layer between the analytics engine and your end-users, handling branding, multi-tenancy, security, and capacity management.